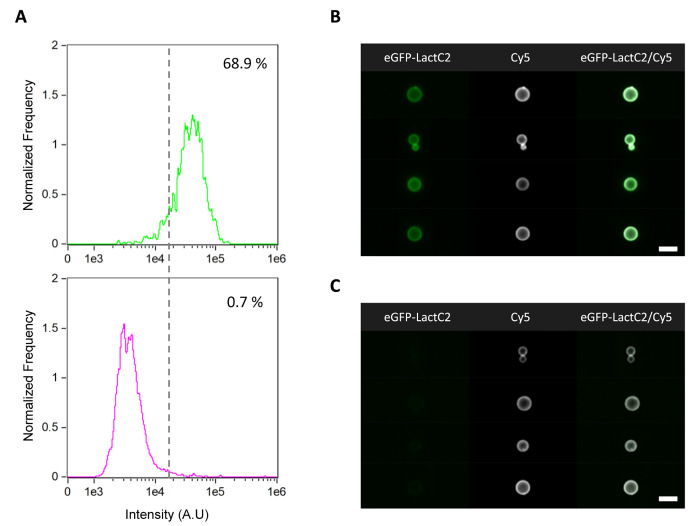
Figure 8.
IFC data analysis of the PssA-catalyzed phosphatidylserine biosynthesis module. (A) Histogram of the fluorescence intensity of the liposome membrane-recruited eGFP-LactC2 (PS-specific probe) in a positive sample (+DNA, top) and in a control negative sample (−DNA, bottom). The control sample was run in order to exclude false positive events resulting from mild unspecific binding of the probe. The applied intensity threshold is indicated by the vertical dashed line and the percentage of PS-containing liposomes is appended in each graph. (B, C) Gallery of representative images of PS-producing (B) and nonproducing (C) liposomes. For all the images, the membrane dye (Cy5) signal is colored in white and eGFP-LactC2 signal is in green. The analysis was performed on a set of over 50,000 liposomes from one sample. Scale bars are 7 μm.

