Figure 2.
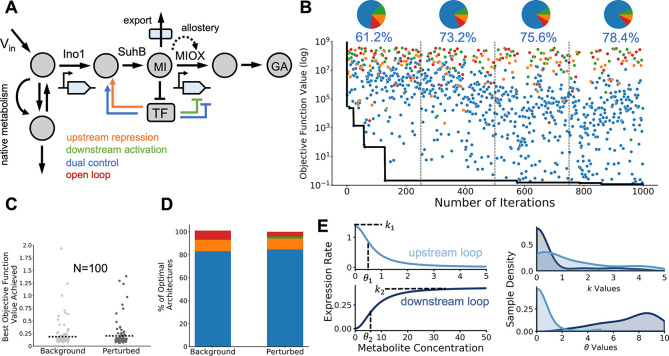
Robustness of optimal circuits to parameter uncertainty. (A) Schematic of a dynamic pathway for production of glucaric acid in Escherichia coli.26 The pathway includes allosteric inhibition and export of an intermediate to the extracellular space. The core pathway components myoinositol (MI) and glucaric acid (GA) are modeled explicitly, as are the enzymes Ino1 and MIOX. The enzyme SuhB is not rate-limiting and is not modeled explicitly. Vin is the constant influx to the engineered pathway from native metabolism. As in Figure 1C, the architectures are named based on the net effect of the metabolite on gene expression. (B) Sample run of the BayesOpt algorithm for 1,000 iterations of the loop in Figure 1B. Black line shows the descent on the value of the objective function. Dots show all samples colored by architecture; pie charts show the fraction of architectures explored by the algorithm, and the fraction of samples taken from the majority architecture (dual control). The first quarter of the run had the most exploration of architectures other than dual control, with 38.6% of samples coming from nonmajority architectures. This percentage steadily decreased over the iterations but did not drop below 20%, illustrating the global nature of the optimization routine. (C) To examine the robustness of the optimal solutions to parameter uncertainty, we computed optimal solutions for many perturbed parameters of the allosteric activation of MIOX by its substrate myoinositol (MI). Strip plot shows the best objective function values achieved for background and perturbed kinetic parameters (Vm,MIOX, aMIOX, ka,MIOX) in eq 4. Kinetic parameters were perturbed using Latin Hypercube sampling56 in the range (−100%, +100%) of the nominal values (Supporting Information). We observed little difference between background and perturbed values; dashed line denotes the mean value of the objective function. Only one of the N = 100 runs for perturbed parameters failed to converge the optimum. (D) Optimal architectures across runs with background and perturbed parameter values. Both background and perturbed systems resulted in over 80% of runs selecting dual control as the optimal architecture. (E) Average dose-response curves and distribution of optimal parameters for the dual control architecture with perturbed allosteric parameters. The repressive and activatory loops have substantially different dose-response curves on average. The distributions of the dose-response parameters (right) show important variations in their mean and dispersion. The parameter ki and θi determine the maximal enzyme expression rate and regulatory threshold, respectively.

