
Figure 4.
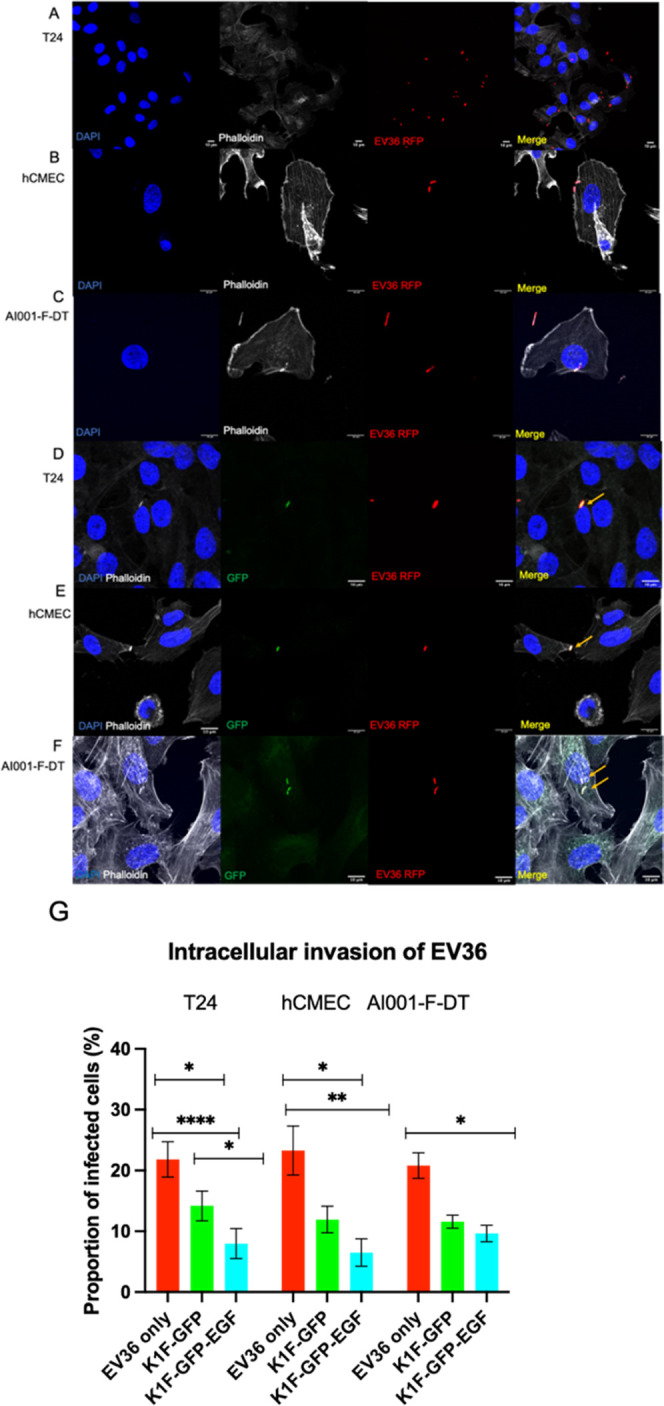
Confocal microscopy analysis of intracellular E. coli O18:K1:H7 infection. (A–C) Intracellular bacteria in the absence of phage; (D–F) Intracellular bacteria in the presence of any K1F derivative. Orange arrows point to colocalization with GFP and RFP channels, where GFP labels the phage and RFP labels the bacterium. (A, D) in T24 cells; (B, E) in hCMECs; (C, F) in AI001-F-DT fibroblast cells. (G) Quantification of EV36 invasion of tested cell lines alone (red), after K1F-GFP addition (green), or K1F-GFP-EGF addition (cyan). Quantification was performed on 30 field-of-view images from n = 3 experiments. At least 250 cells were enumerated for each condition and for each cell line. A one-way ANOVA was used with post-hoc Tukey tests to probe for differences between groups.