
Figure 1:
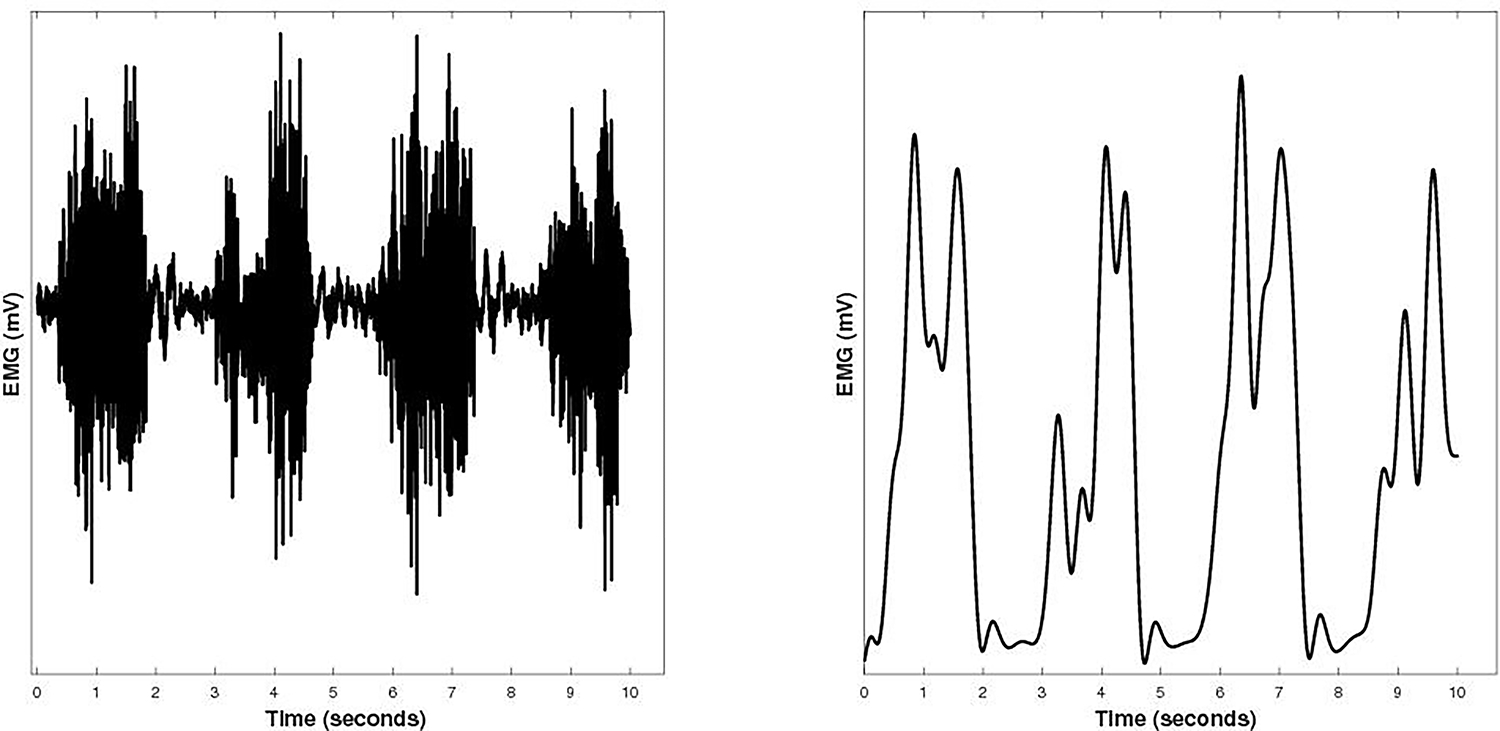
Depicts a 10 second EMG signal from the left gastrocnemius of a representative spinal cord injury subject during exercise bout 1 of a constant work rate test. The left side represents the raw unfiltered EMG signal, while on the right shows the EMG signal following the creation of the linear envelope.