
Figure 3:
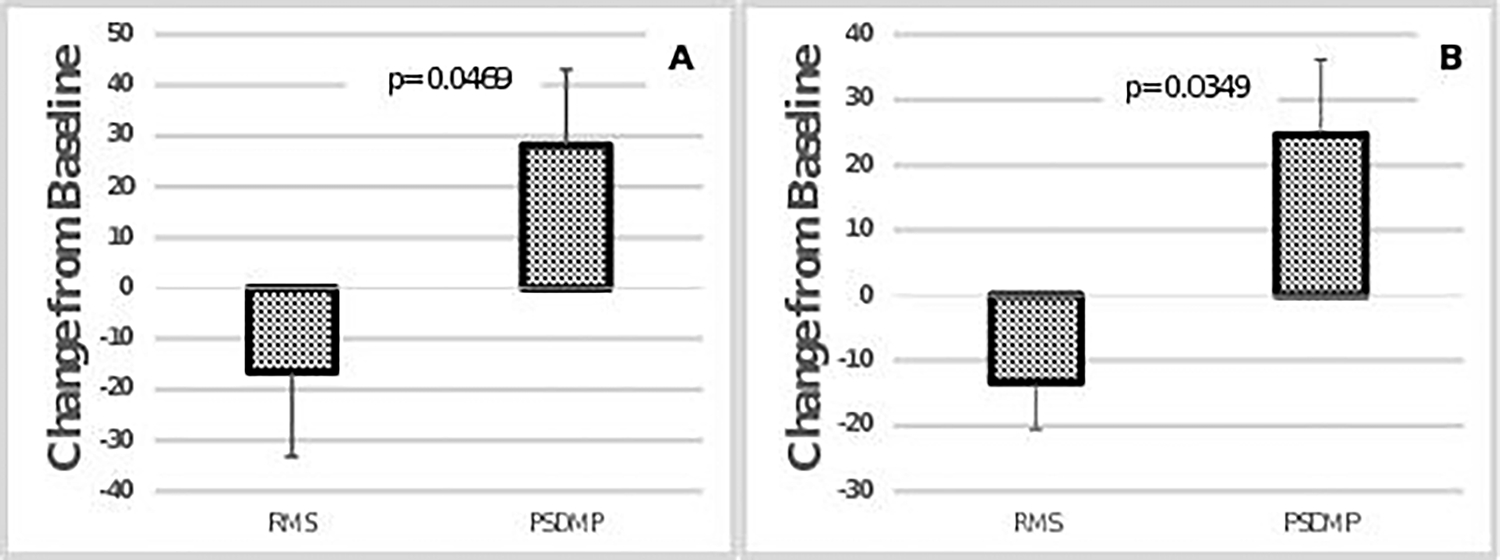
Absolute change score during post testing compared to pre OLT for EMG exercise bout 1, (A) and exercise bout 2, (B). P-values indicate difference between pre and post OLT. Error bars represent standard deviation.
Official websites use .gov
A
.gov website belongs to an official
government organization in the United States.
Secure .gov websites use HTTPS
A lock (
) or https:// means you've safely
connected to the .gov website. Share sensitive
information only on official, secure websites.
Absolute change score during post testing compared to pre OLT for EMG exercise bout 1, (A) and exercise bout 2, (B). P-values indicate difference between pre and post OLT. Error bars represent standard deviation.