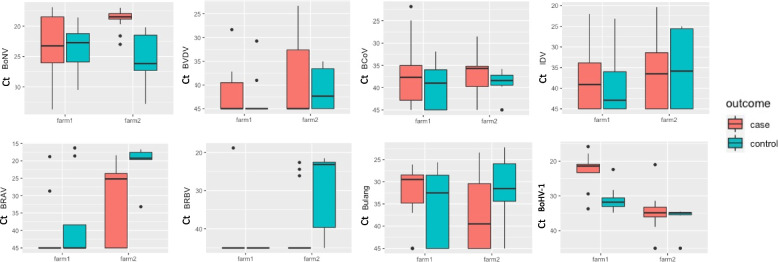
Fig. 3.
Boxplot of PCR results per feedlot and disease status (case or clinical bovine respiratory disease and BRD unaffected control). The y-axis are the Ct values (lower Ct values are a proxy to higher viral load). The colour of the boxplot represents the case or control status, and the x-axis for each virus plot group the results by feedlot (farm). The number of sample tubes represented are as follows: feedlot 1 cases n = 9; controls n = 8, feedlot 2 cases n = 16; controls = 6. In total, these sample tubes contained pooled swabs from 113 animals

