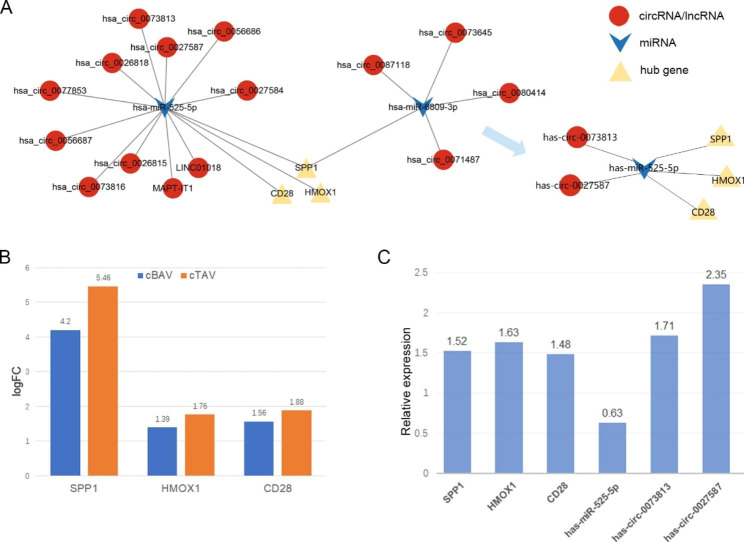
Fig. 2.
The circRNA/lncRNA–miRNA–hub gene network and validation of the hub genes, miRNAs and circRNAs. (A) The circRNA/lncRNA–miRNA–hub gene network was constructed according to the ceRNA hypothesis and a subnetwork confirmed by qRT-PCR. Red and yellow represent up-regulation and blue means down-regulation. (B) GSE148219 and GSE76718 were used to validate the hub genes, and the intensity of differential expression is shown as a bar graph. (C) The relative expression of hub genes, miRNAs and circRNAs by qRT-PCR. Results are expressed as fold changes of control group

