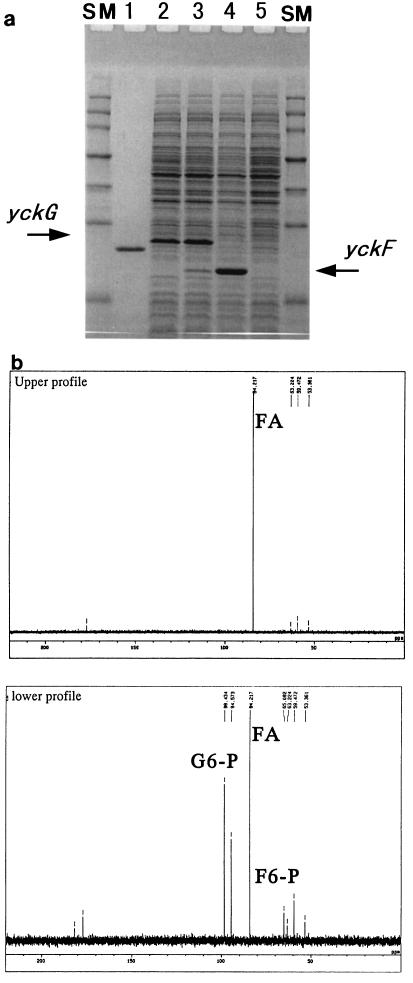
FIG. 3.
Analysis of the products of yckG and yckF. (a) The yckG and/or yckF gene was overproduced in E. coli and analyzed by SDS-PAGE. Cells harboring the expression plasmid were cultured in M9 medium supplemented with Casamino Acids, thiamine, and metal ions. Indoleacrylic acid was added to induce the expression of each gene. Aliquots were taken from cells harboring pT-Bsb-yckG (lane 2), pT-Bsb-yckGF (lane 3), pT-Bsb-yckF (lane 4), and the control plasmid (lane 5). The single band in lane 1 indicates the position of purified HPS of M. aminofaciens 77a, and the positions of YckG and YckF are shown by arrows. The positions of migration of molecular mass standards (SM) are indicated on both sides of the gel (from top to bottom, 150, 100, 75, 50, 35, 25, and 15 kDa). (b) Formation of glucose-6-phosphate and fructose-6-phosphate by the condensation of 13C-labeled formaldehyde and Ru5P and the subsequent isomerization of sugar-phosphates was analyzed by 13C NMR spectrometry as described in the text. The upper profile exhibits the peak of formaldehyde (FA) in the test mixture, in which the reaction was immediately stopped after addition of cell extract containing YckG and YckF; the lower profile displays the carbon peaks in the reaction mixture after incubation for 20 min at 37°C. The C-1 (α,β anomers) positions of glucose-6-phosphate (G6-P) and fructose-6-phosphate (F6-P) are indicated.

