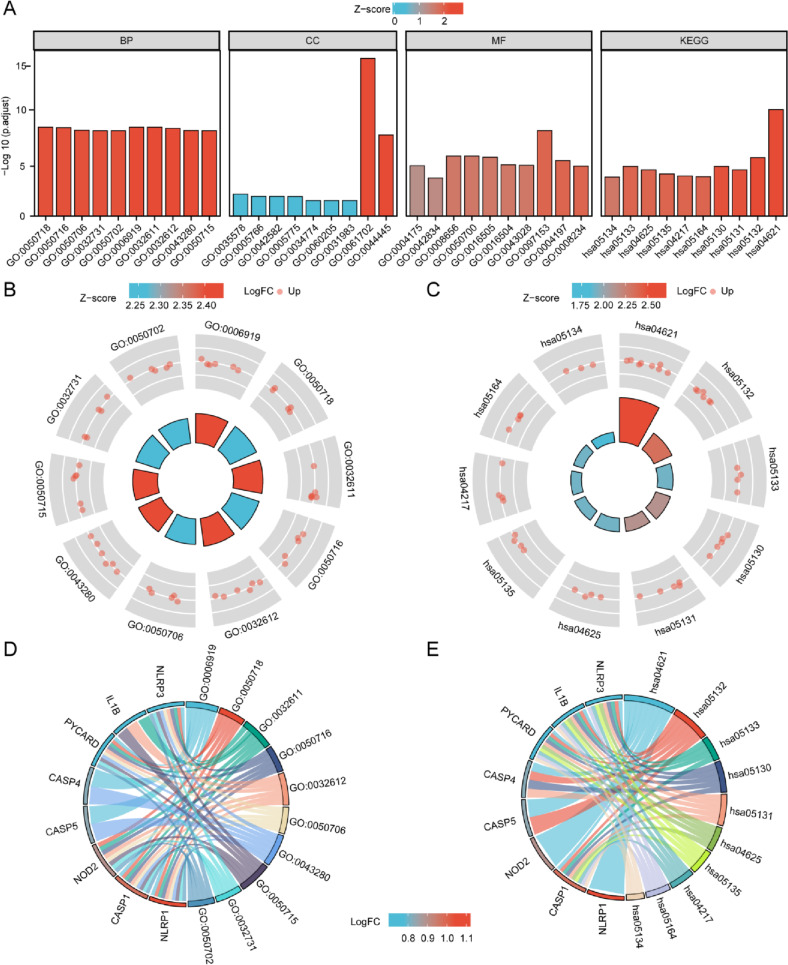
Fig. 3.
GO analysis and KEGG pathway functional enrichment analysis of 10 pyroptosis-related differentially expressed genes in SONFH and non-SONFH samples. A Bar plot of the top 10 enriched BP terms, CC terms MF terms and KEGG pathway terms of these 30 genes. B Circle plot of the top 10 enriched BP terms of these 10 genes. C Circle plot of top 10 enriched KEGG terms of these 10 genes. D Chord plot of relationship among the top 10 enriched BP terms and targets. E Chord plot of relationship among the top 10 enriched KEGG pathway terms and targets. The colours of the nodes range from red to blue in descending order of logFC values. The genes are ordered according to logFC values

