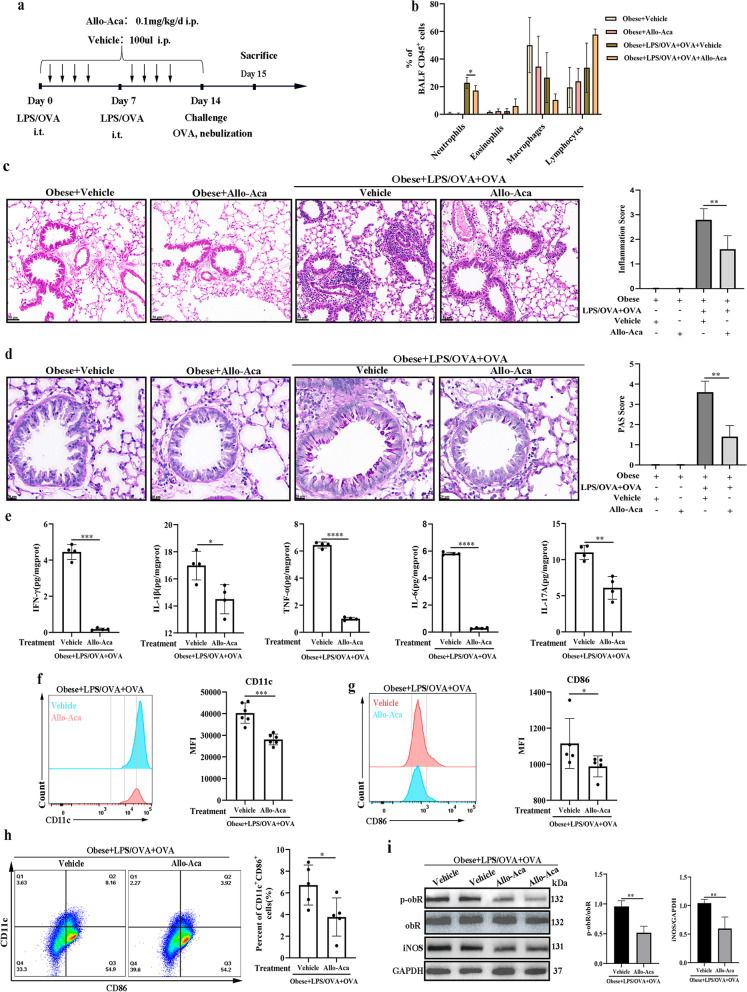
Fig. 3.
Allo-Aca inhibited M1 macrophage polarization and obesity-related murine neutrophilic airway inflammation in a female obese mouse model. a Flow chart for Allo-Aca or vehicle administration in a female obesity-related neutrophilic airway inflammation mouse model. b Neutrophil, eosinophil, macrophage, and lymphocyte percentages in BALF. c Representative H&E-stained histological lung sections and a bar graph showing the inflammation scores. Scale bar = 50 μm. d Representative PAS-stained histological lung sections and a bar graph showing the PAS scores. Scale bar = 20 μm. e The levels of inflammatory cytokines (IFN-γ, TNF-α, IL-1β, IL-6, and IL-17A) in lung homogenates. f Representative histogram of CD11c (M1) expression (left) and quantitative analysis of CD11c (right) expression in BALF. g Representative histogram of CD86 (M1) expression (left) and quantitative analysis of CD86 (right) expression in BALF. h Representative flow cytometry analysis to detect M1 macrophages (CD11c+CD86+) (gating in macrophages) (left) and quantification of M1 macrophage number (right) in lung single-cell suspensions. i Western blot analysis of obR-b phosphorylation and iNOS expression in lung tissues. The relative expression of protein displayed the ratio of phosphorylated protein or iNOS protein to total protein. The data are expressed as the means ± SDs. *P < 0.05, **P < 0.01, ***P < 0.001, ****P < 0.0001. i.t., intratracheal; i.p., intraperitoneal. For a–d, n = 4–6 female mice per group; for e, n = 4 female mice per group; for f, n = 6 female mice per group; for g, h, n = 5 female mice per group; for i, n = 3 female mice per group

