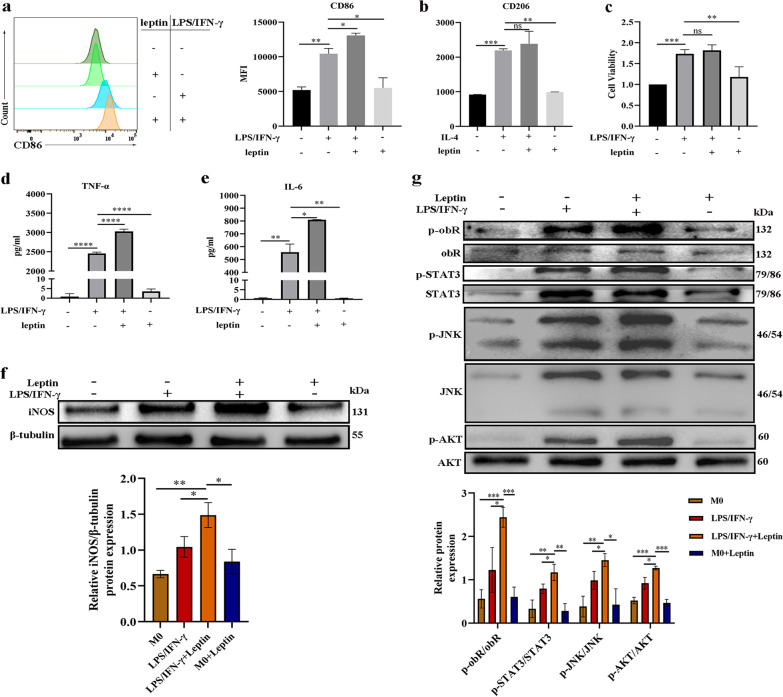
Fig. 5.
The mechanisms by which leptin affects M1 macrophage polarization. a Representative histogram of CD86 expression (left) and quantitative analysis of CD86 (right) expression in BMDMs. b Quantitative analysis of CD206 expression in BMDMs. c Cell viability. d, e Levels of inflammatory cytokines (TNF-α and IL-6) in cell-free supernatants of BMDMs. f Western blot analysis of iNOS in BMDMs and β-tubulin was used as a loading control. The displayed protein expression value is the ratio of iNOS protein to total protein. g Western blot analysis of the phosphorylation levels of obR-b and members of the downstream JNK/STAT3/AKT pathways in BMDMs. The displayed protein expression value is the ratio of phosphorylated protein to total protein. *P < 0.05, **P < 0.01, ***P < 0.001, ****P < 0.0001, each experiment was performed three times

