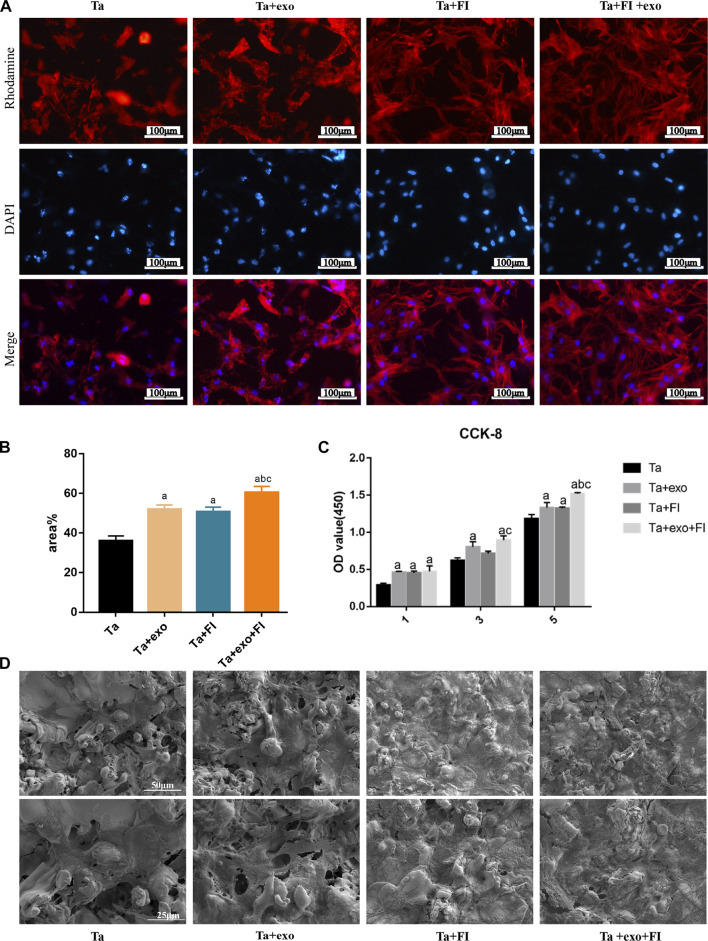
FIGURE 4.
Adhesion and proliferation of BMSCs on different surfaces. (A). Morphologies of BMSCs after 6 h of adhesion by fluorescence staining. (B). Quantitative analysis of cell adhesion (n = 3); (C). The proliferation of BMSCs on different samples after 1, 3, and 5 days (n = 3). (D). SEM of BMSCs morphologies after 3d on different samples (a. p < 0.05, compare with Ta; b. p < 0.05, compare with Ta + exo; c. p < 0.05, compare with Ta + FI).

