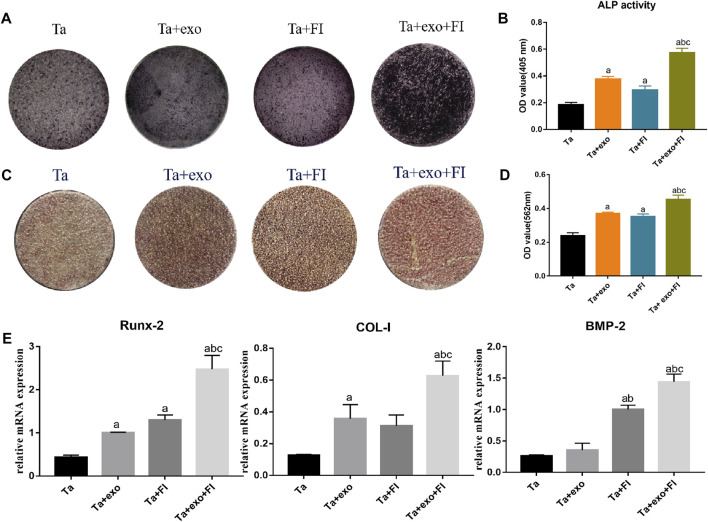
FIGURE 5.
Osteogenic differentiation of BMSCs on different samples. (A). ALP staining at 14d; (B). ALP activities at 14 days (n = 3); (C). Alizarin red S staining at 21d; (D). Cell mineralization after culturing for 21 days (n = 3). (E). The expressions of Runx2, COL-I, and BMP-2 gene of cells detected by RT-PCR at day 7 (n = 3). (a. p < 0.05, compare with Ta; b. p < 0.05, compare with Ta + exo; c. p < 0.05, compare with Ta + FI).

