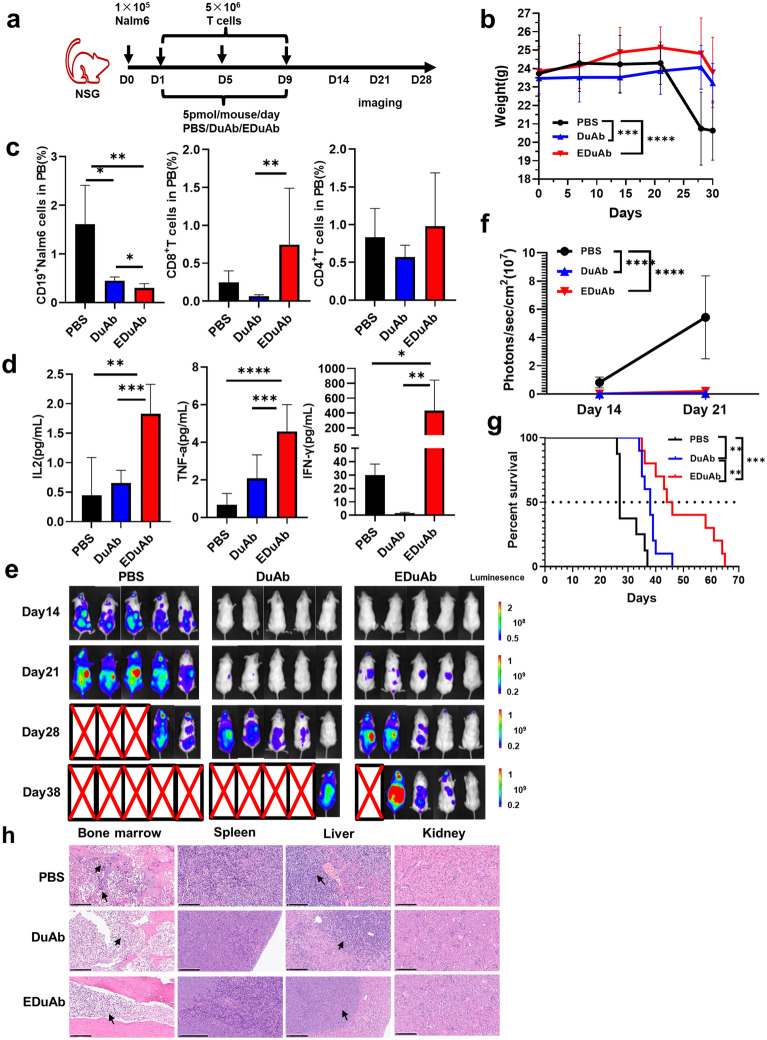
Fig. 6.
In vivo activity of DuAb and EDuAb a Schematic diagram of in vivo evaluation of DuAb and EDuAb. b Average body weight of three groups after PBS, DuAb and EDuAb treatment. c The residual Nalm6 cells (Left panel) and the phenotype of T cells (Middle and Right panel) in PB on day 24. d Cytokine release in PB on day24. e Representative IVIS imaging of tumor burden monitored by BLI at day 14, 21, 28 and 38. f Average radiance quantification (p/sec/cm2/sr) of image e for Nalm6 cells on day 14 and 21. g Kaplan–Meier survival curves of three groups. h Pathological analysis of the bone marrow, spleen, liver and kidney of the three representative mice in PBS, DuAb and EDuAb groups at their terminal stage by using HE staining

