
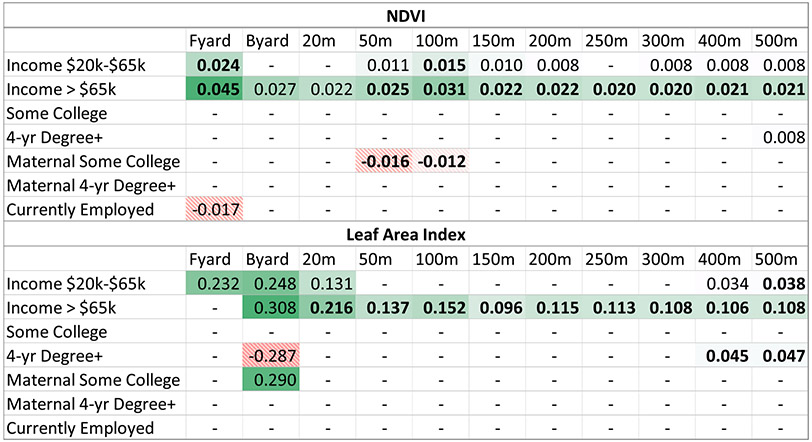
Table 2.
Adjusted associations between individual- and neighborhood-level SES indicators and greenness.
|
Notes: N = 636. Models adjusted for participants’ age, gender, race, income, education, mother’s education, employment status, and traffic density. Parameter coefficient estimates from linear regression model. Only coefficient estimates with p < 0.10 are shown. Coefficients estimates with p < 0.05 are shown in bold and identified in the text as significant, with p = 0.05–0.10 identified as marginally significant. Coefficient estimates with p > 0.10 are replaced with a dash (−). Table cells are colored by effect size on a dark to white scale, green solid color for positive significant or marginally significant associations and dashed red for inverse associations. Fyard = participants’ front yard, Byard = participants’ back yard. Reference groups include for Income, < $20,000; for education, ≤high school graduate; for maternal education, ≤high school graduate; employment, not currently employed.