Fig. 1.
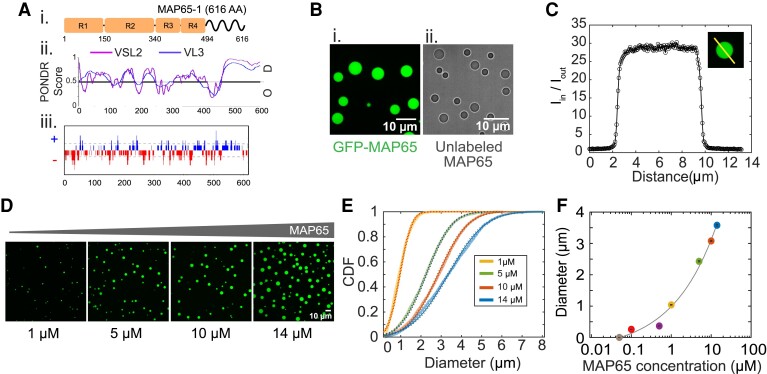
MAP65 can form liquid condensates. A) (i) Cartoon of MAP65 sequence regions. and boxes represent spectrin domains. Tail domain is an IDR. (ii) Predicted disorder probability from PONDR algorithms, VSL2 (magenta) and VL3 (blue). Score >0.5 is considered disordered. (iii) Predicted net charge per residue (NCPR) distribution from CIDER with positive charges (blue) and negative charges (red). B) Images of phase separated MAP65 in (i) confocal fluorescence or (ii) transmitted light microscopy. Scale bars are 10 m. C) Quantification of the partition coefficient, p, from the intensity profile of a confocal slice through the center of a droplet. Intensity is normalized so that the background level is one. D) Confocal fluorescence images of droplets showing diameter increases with MAP65 concentration for 1, 5, 10, and 14 M. Scale bar is 10 m. E) Cumulative distribution functions of droplet diameter for 1 M (yellow, left-most curve), 5 M (green, second curve), 10 M (red, third curve), and 14 M (blue, right-most curve) MAP65 concentrations. Each is fit to a normal distribution to find the mean (same as median) and standard error of mean. F) Median diameter of droplets for 50 nM, 100 nM, 500 nM (purple), 1 M, 5 M, 10 M, and 14 M MAP65 concentrations. Data fit with an shifted power law function, . The best fit parameters are given in the Supplementary material.

