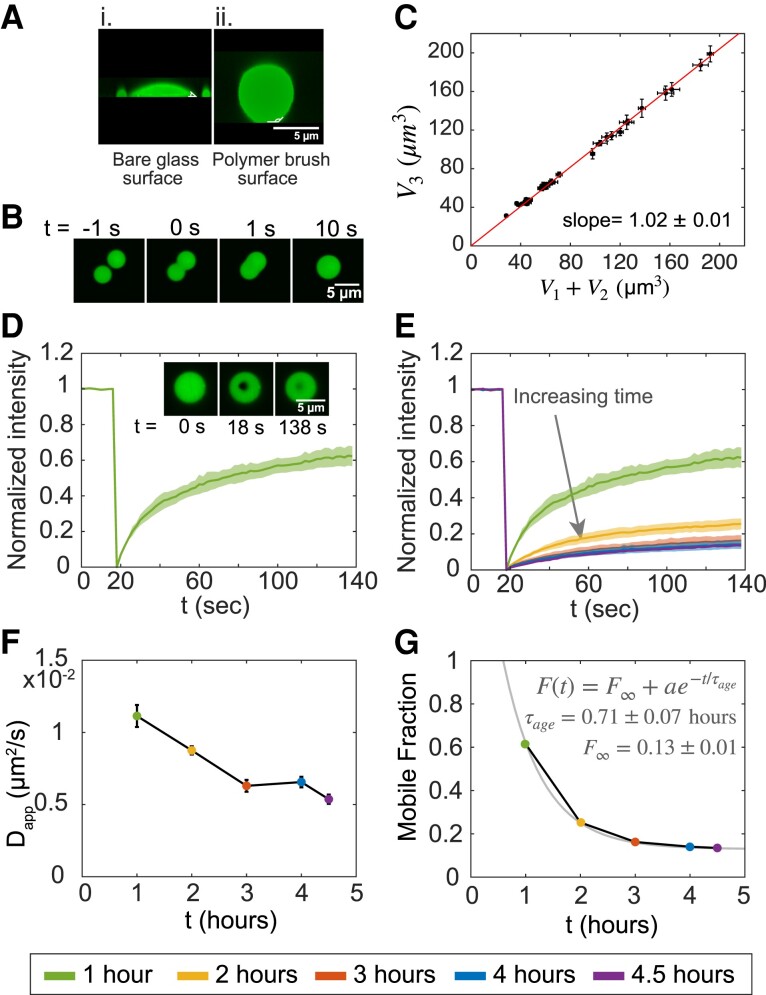
Fig. 2.
MAP65 droplet materials properties. A) Confocal images of droplets in the X–Z plane for MAP65 condensates (i) on bare glass, and (ii) on a polymer brush surface. Scale bar is 5 m. B) Images of droplet fusion over time where s indicates the frame where fusion starts. Scale bar is 5 m. C) Plot of the volume of the sum of the droplets’ volume before fusion, , and after fusion, (). The best fit slope is , indicating that volume is conserved. D) Quantification of FRAP normalized such that the initial intensity is one and the minimum intensity is zero with average (dark green line) and standard deviation (green shaded region) displayed (). Image inset: FRAP sample data with droplet before bleach ( s), at bleach ( s), and after recovery ( s). Scale bar is 5 m. E) Normalized FRAP recovery curves for each five time points for maturation times of 1 h (, green, upper-most curve), 2 h (, yellow, second curve from top), 3 h (, red, third curve), 4 h (, blue, fourth curve), and 4.5 h (, purple, bottom curve). The shaded regions indicates the standard deviation around the mean. F) Apparent diffusion coefficients calculated from FRAP recovery time, , plotted against maturation time. The bars indicate a 95 confidence interval. G) Mobile fraction data show exponential decay plotted against maturation time. The exponential decay fit (grey line) yields a characteristic aging time h with mobile fraction at long time, , to be ∼13%.

