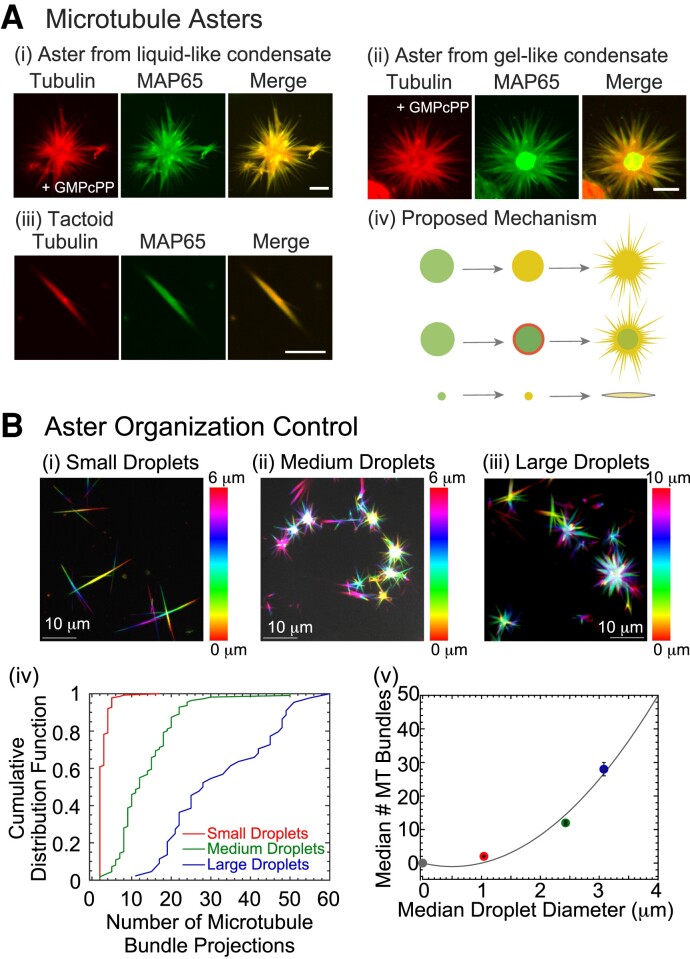
Fig. 4.
MAP65 droplets organize microtubule bundles into asters and tactoids. A) Microtubules nucleate and grow bundles from MAP65 condensates. (i) Maximum projection of confocal z-stack for microtubule aster formed from liquid-like condensate showing tubulin (left), GFP-MAP65 (middle) and merge (right). (ii) Maximum projection of confocal z-stack for microtubule aster formed from gel-like condensate showing tubulin (left), GFP-MAP65 (middle), and merge (right). (iii) Maximum projection of confocal z-stack for microtubule tactoid formed from small condensate showing tubulin (left), GFP-MAP65 (middle) and merge (right). Scale bars are 5 m for all images. (iv) Cartoon schematic of aster and tactoid formation. B) Confocal z-stack images of microtubule organizations in the presence of (i) small droplets with median diameter of for , (ii) medium droplets with median diameter of for , and (iii) large droplets with median diameter of for . Color coding for all images based on z-height given by color bars; scale bar is 10 m. (iv) Cumulative probability distribution function of the number of microtubule bundle projections for small (red line, left-most curve), medium (green line, center curve), and large (blue line, right-most curve) droplets. (v) The median number of microtubule bundle projections plotted against the median diameter of the MAP65 condensates to show a quadratic relationship, fit with a parabola (fit parameters in Supplementary material). Error bars represented the standard error of the mean for the droplet diameter (horizontal) and the number of projections (vertical).

