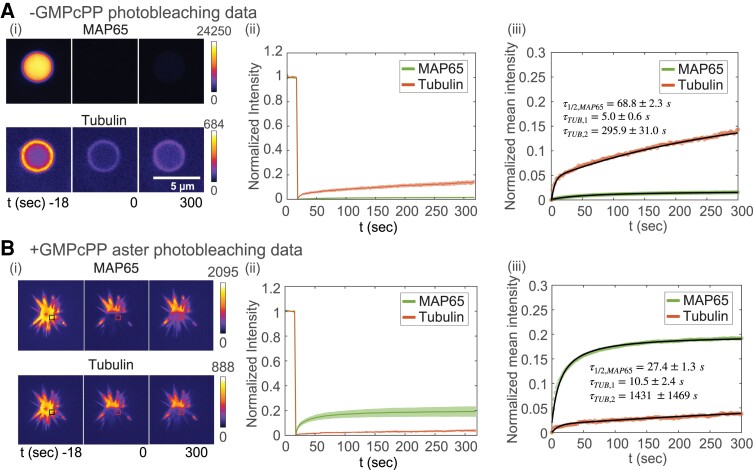
Fig. 5.
Photobleaching experiments on gel-like MAP65 condensates in presence of tubulin without and with nucleotide to form microtubules. A) FRAP on condensate. (i) Time series images of whole droplet FRAP for time points at , 0, and 300 s after photobleaching for GFP-MAP65 (top) and rhodamine-tubulin (bottom). Intensity portrayed using fire look up table, as denoted by color bar and ranges given. Scale bar is 5 M. (ii) Normalized FRAP recovery curves for GFP-MAP65 (green, lower curve) and rhodamine-tubulin (red, upper curve). The shaded region denotes the standard deviation around the mean (). (iii) Normalized mean intensity curves fit with Eq. [1] in Supplementary material for GFP-MAP65 (green data, black line, lower curve) or biphasic exponential recovery for tubulin (red data, black line, upper curve). B) FRAP on asters. (i) Time series images of partial aster FRAP for time points at , 0, and 300 s after photobleaching for GFP-MAP65 (top) and rhodamine-tubulin (bottom). Intensity portrayed using fire look up table, as denoted by color bar and ranges given. Boxes represent area where analysis was performed. Scale bar is 5 M. (ii) Normalized FRAP recovery curves for GFP-MAP65 (green, upper curve) and rhodamine-tubulin (red, lower curve). The shaded region denotes the standard deviation around the mean (). (iii) Normalized mean intensity curves fit with Eq. [1] in Supplementary material for GFP-MAP65 (green data, black line, upper curve), or biphasic exponential recovery for tubulin (red data, black line, lower curve).

