
Figure 2.
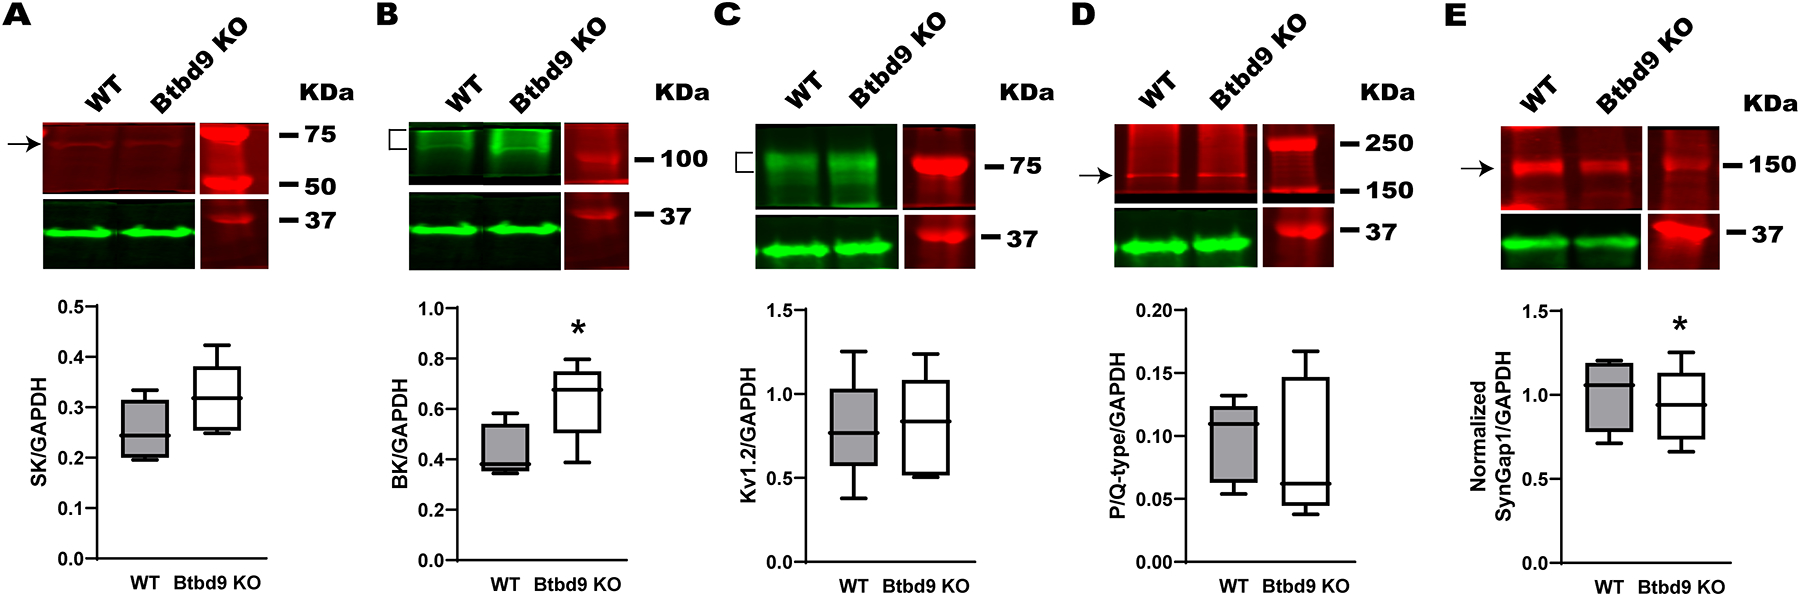
Western blot of cerebellar tissues from the systematic Btbd9 KO mice (n=5) and their WT littermates (n=5). While the SK channel (A), P/Q, and Kv1.2 channels (C, D) were not different between the Btbd9 KO mice and the WTs, Btbd9 KO mice had increased levels of the BK channel (B). (E) Btbd9 KO mice had decreased levels of SYNGAP1. Target protein bands were normalized to the GAPDH at the bottom of each figure. Blots were cropped to show the representative bands. The experiment was done in duplicate. Data are presented as box-and-whiskers plots, with the “box” depicting the median and the 25th and 75th quartiles and the “whisker” showing the 5th and 95th percentile. *, p ≤ 0.05.