
Figure 3.
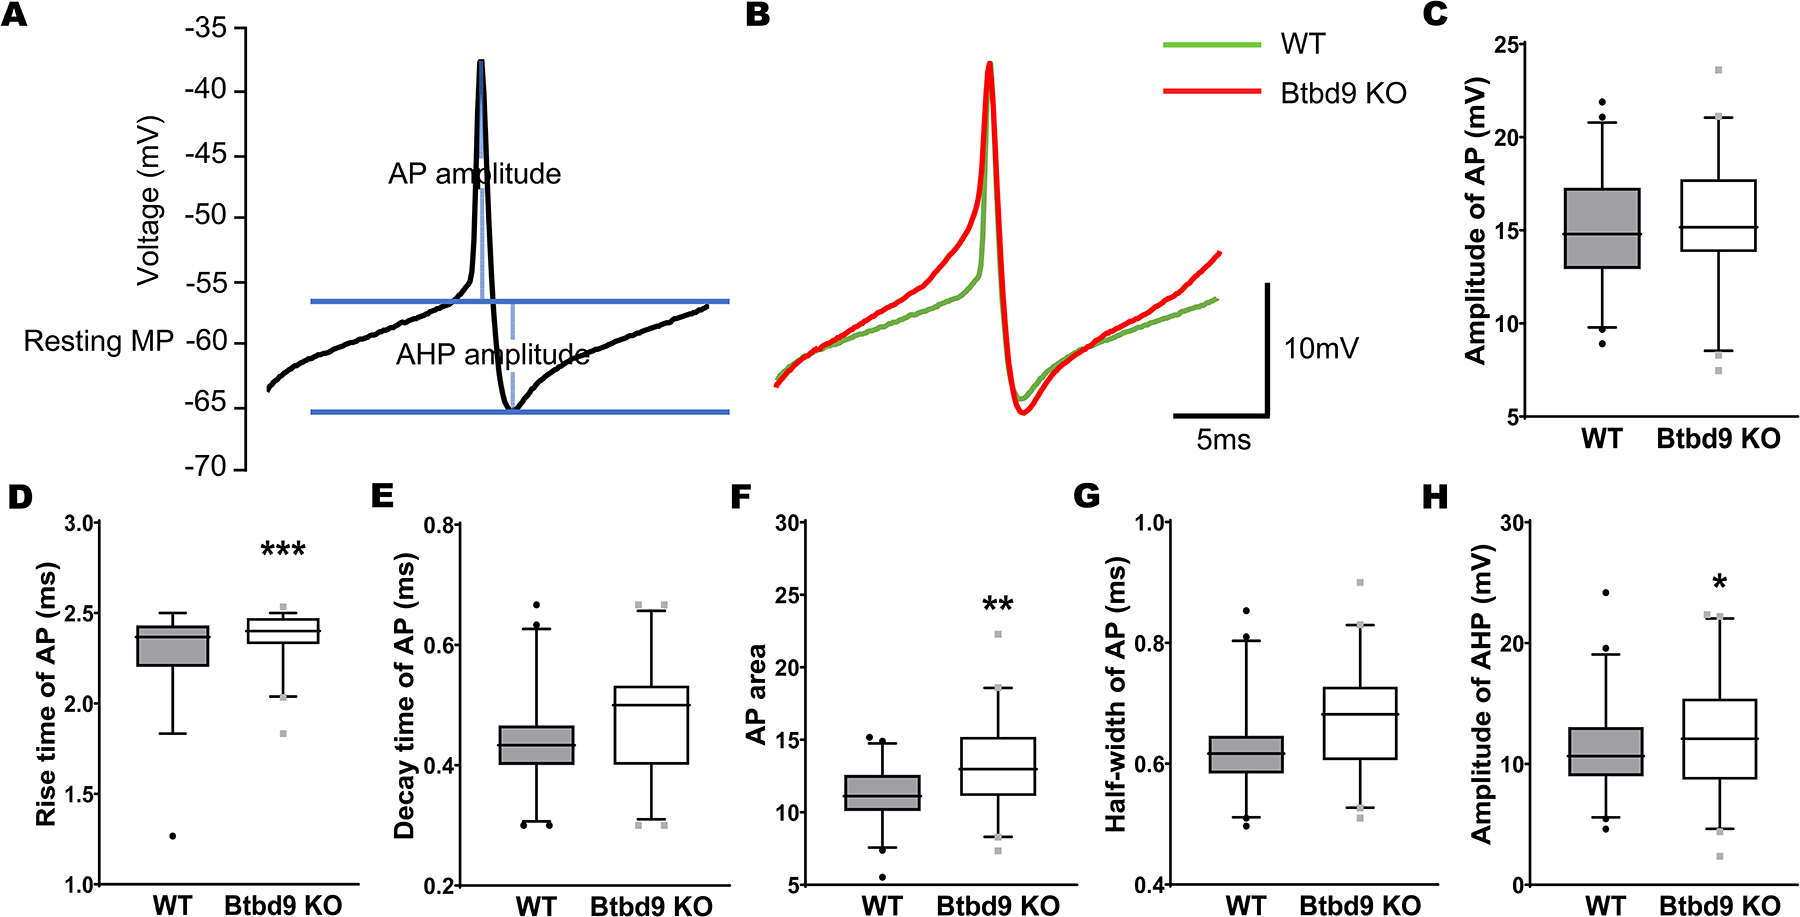
Comparison of AP and AHP from the whole-cell recording of PCs of the systemic Btbd9 KO mice (n=6 mice and 42 cells) and their WT littermates (n=6 mice and 43 cells). (A) Diagram showing how AP and AHP were measured. The y-axis shows the voltages without adjusting the junction potential (−14.5 mV). (B) Representative traces of AP and AHP from WT and KO mice. (C-G) AP parameters. The rise time and area of AP were significantly increased in Btbd9 KO PCs compared with that of the WTs. (H) The amplitude of AHP was significantly increased in Btbd9 KO PCs compared with that of the WTs. Data in C-H are presented as box-and-whiskers plots, with the “box” depicting the median and the 25th and 75th quartiles and the “whisker” showing the 5th and 95th percentile. ***, p ≤ 0.001, **, p ≤ 0.01, *, p ≤ 0.05.