
Figure 4.
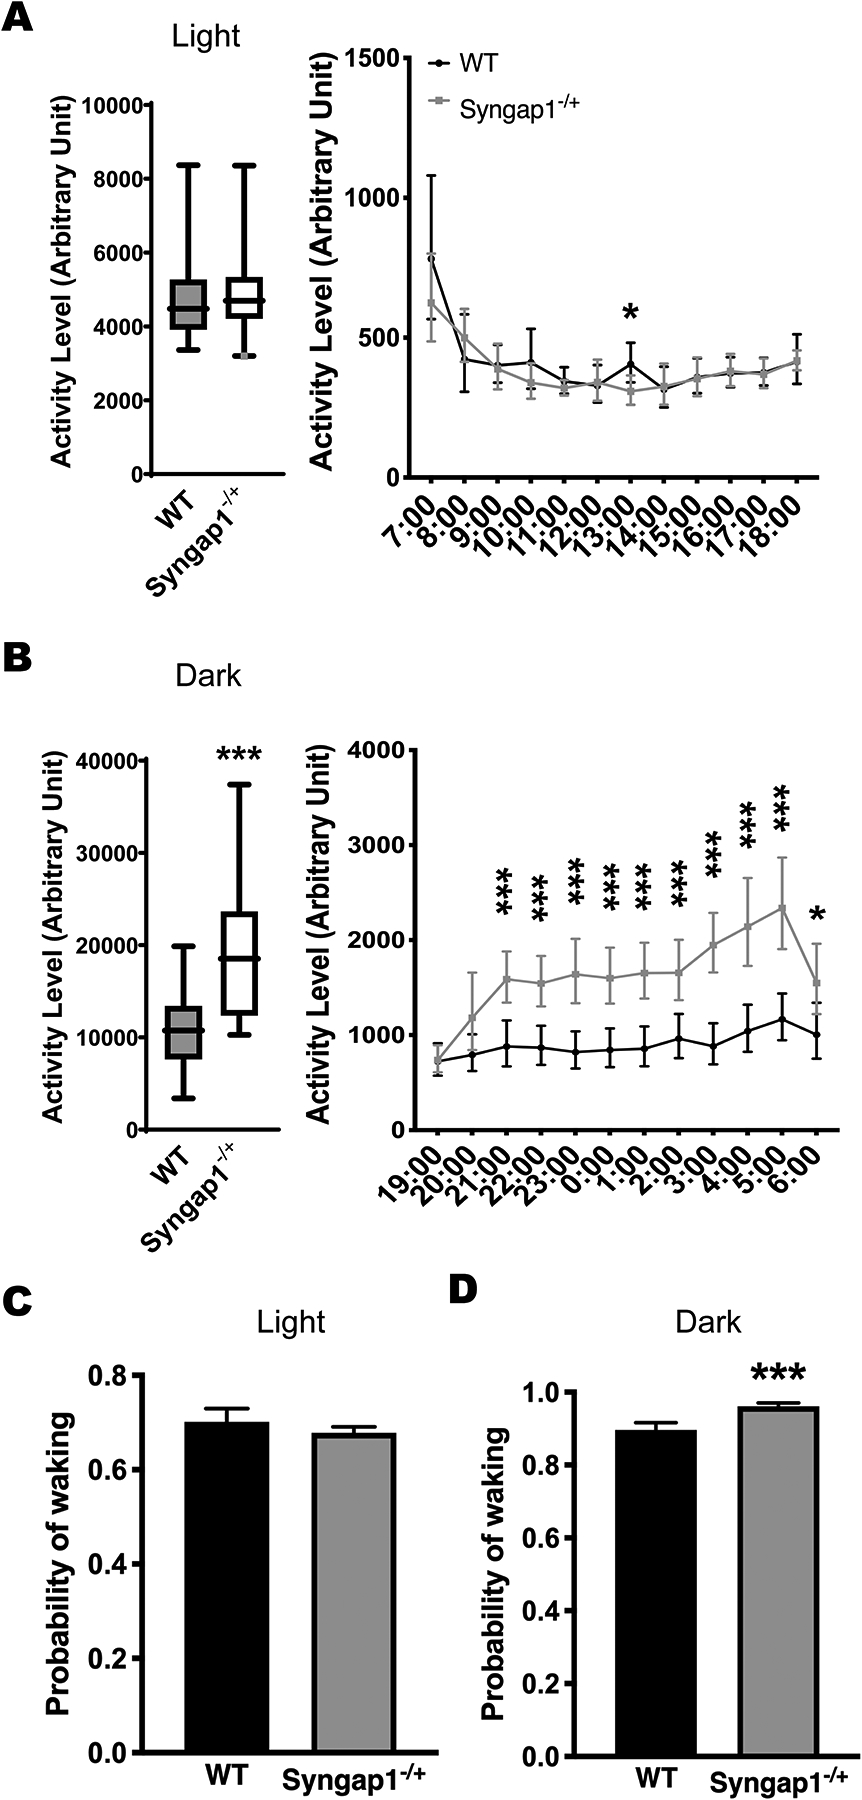
The home-cage activity of Syngap1−/+ (n=19) compared with the WT mice (n=14). (A) Syngap1−/+ mice did not have activity changes during the light phase compared with the WT mice. (B) Syngap1−/+ mice showed hyperactivity during the dark phase. Data are presented as box-and-whiskers plots, with the “box” depicting the median and the 25th and 75th quartiles and the “whisker” showing the 5th and 95th percentile. The hourly activity levels are presented next to the corresponding box-and-whiskers plots. Significant p values are marked above each time point. (C, D) Syngap1−/+ mice showed an increased probability of waking during the dark phase but not during the light phase. Histograms represent means plus 95% CIs. ***, p ≤ 0.001, *, p ≤ 0.05.