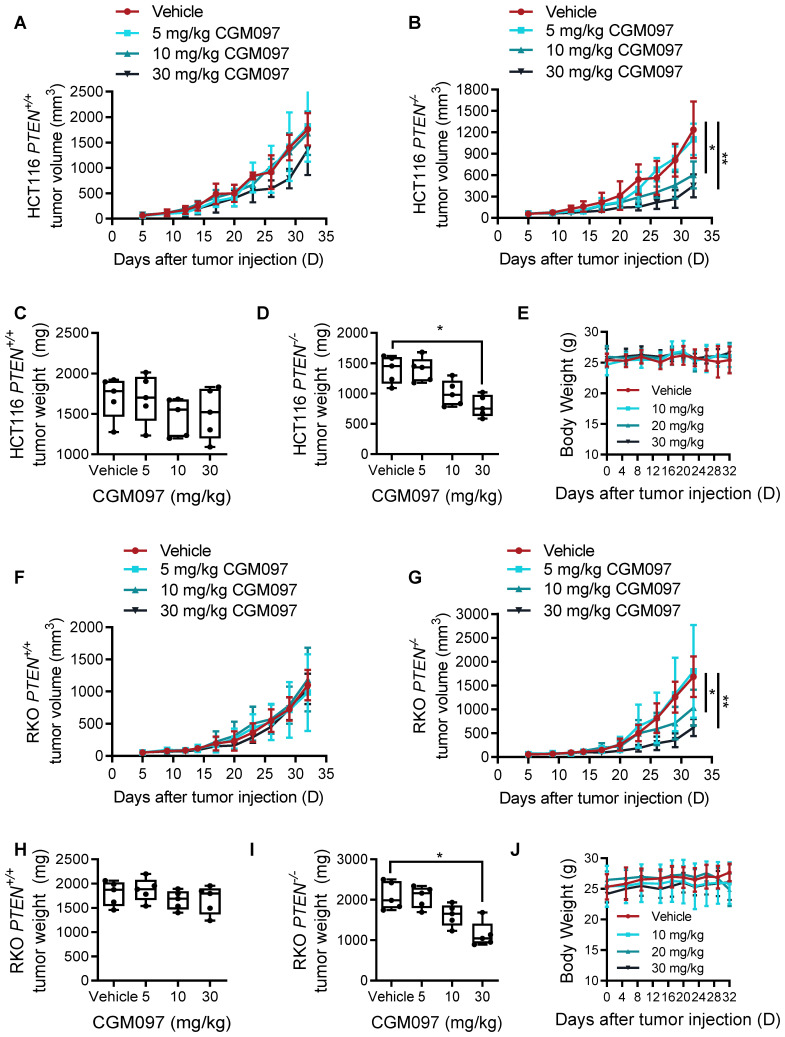
Figure 2.
PTEN and MDM2 show a synthetic lethal interaction in vivo. Tumor volume (A, B) and tumor weight (C, D) curves in nude mice bearing HCT116 PTEN+/+ and PTEN-/- tumor xenografts treated with vehicle, 5 mg/kg CGM097, 10 mg/kg CGM097 or 30 mg/kg CGM097. E. HCT116 tumor mice model body weight in nude mice treated by the indicated concentrations of CGM097. Tumor volume (F, G) and tumor weight (H, I) curves in nude mice bearing RKO PTEN+/+ and PTEN-/- tumor xenografts treated with the indicated concentrations of CGM097. K. RKO tumor mice model body weight in each group were shown. The statistical analysis between two groups in tumor volume and tumor weight was conducted by two-way ANOVA test. *P < 0.05; **P < 0.01 between two indicated bars.

