
FIGURE 2.
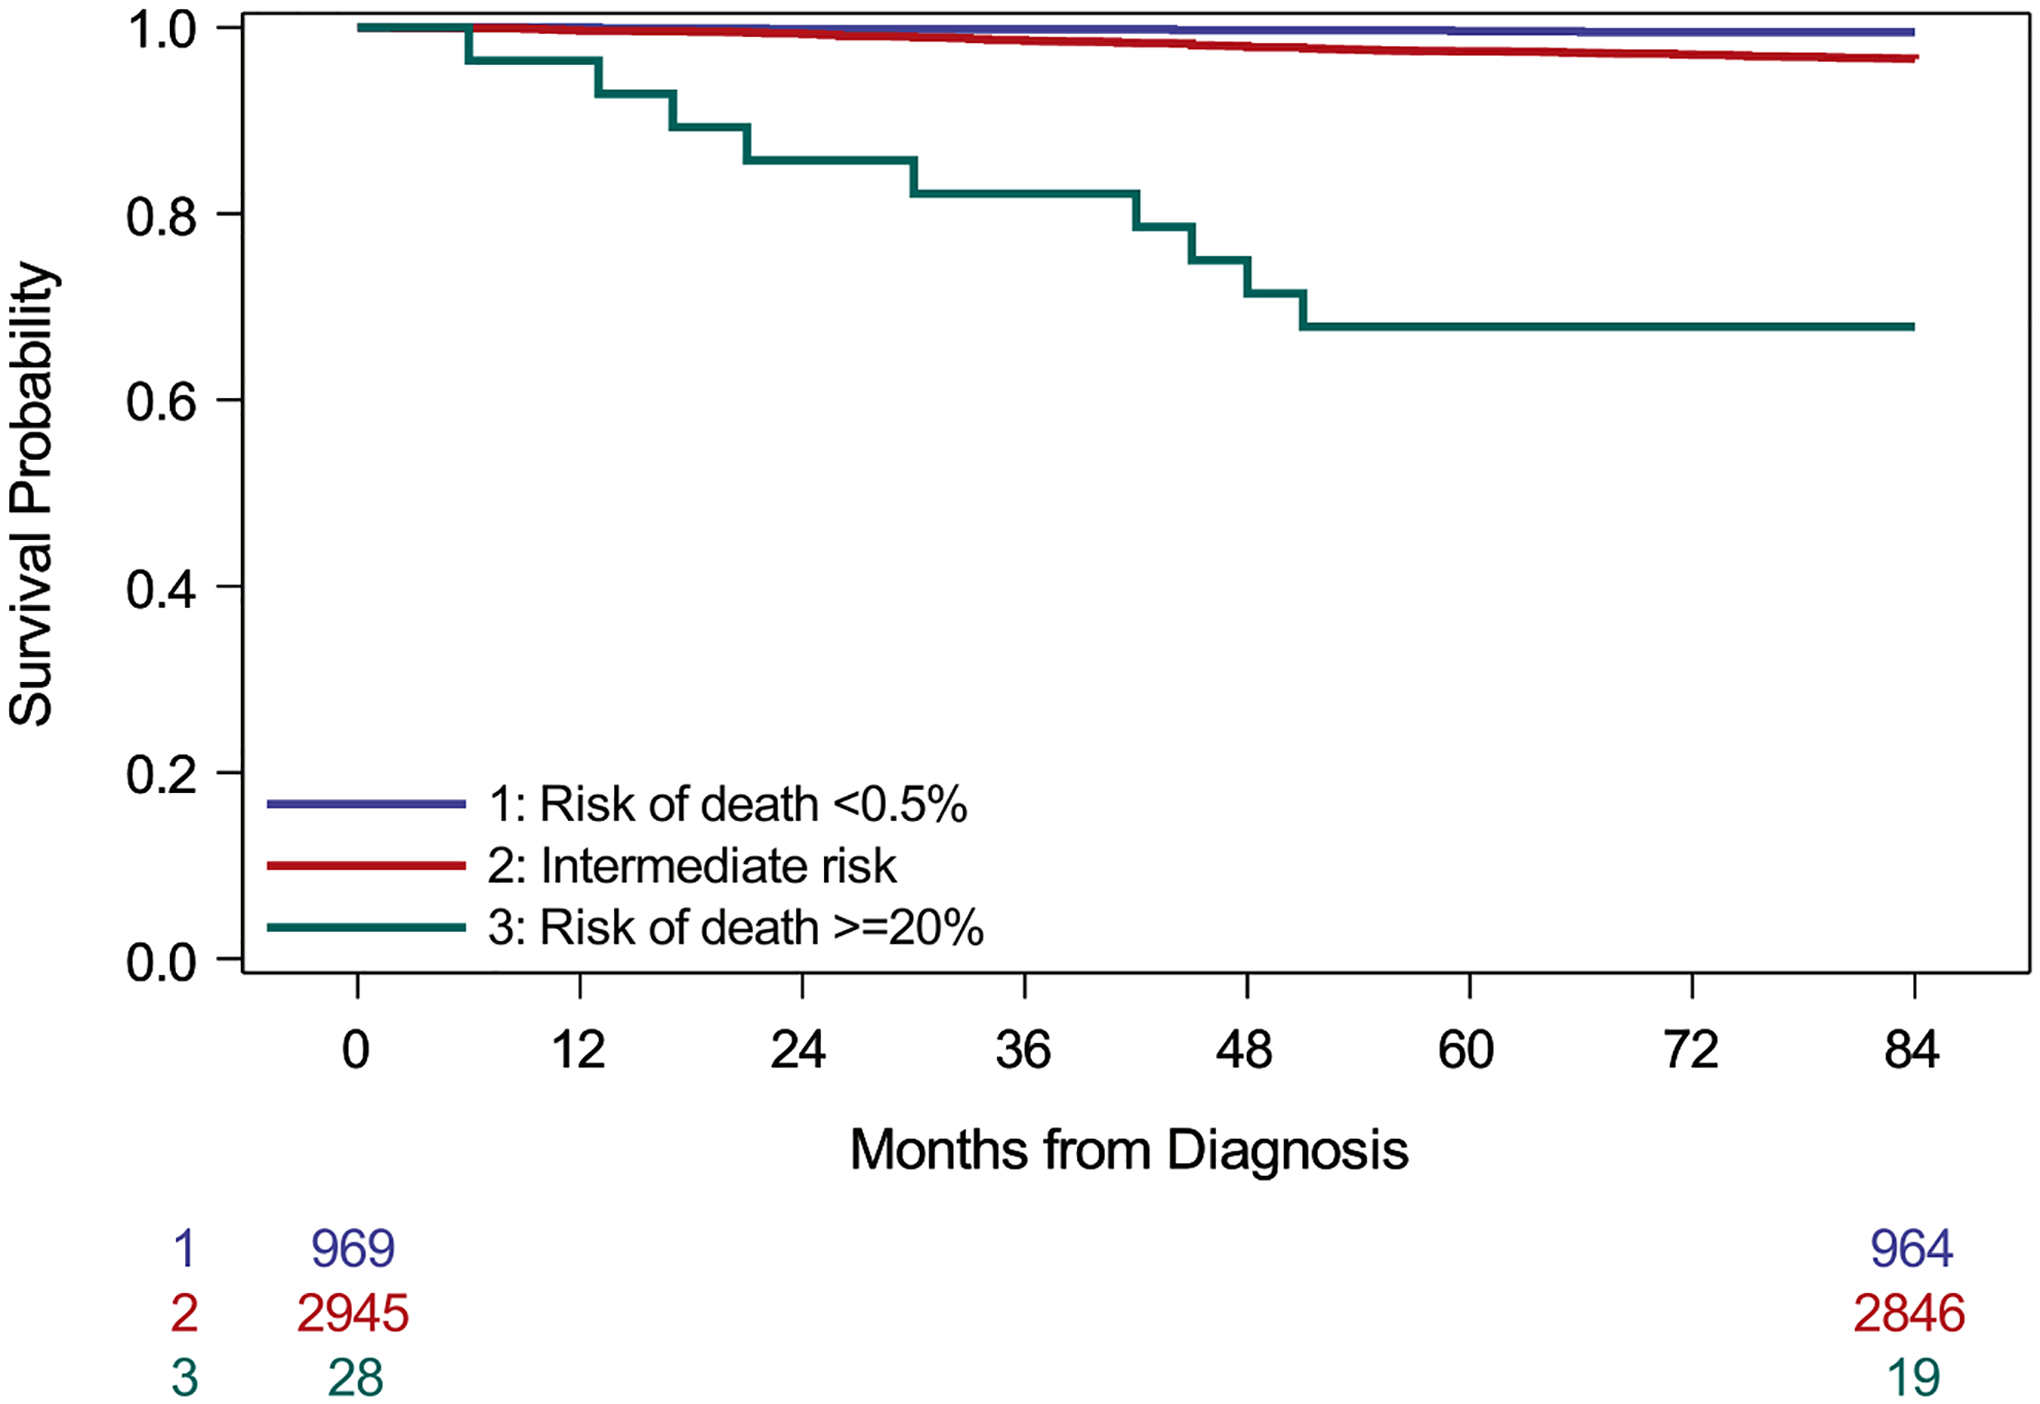
Survival among patients in the testing data by estimated risk of death according to Model 2 (logistic regression analysis). Risk categories are based on recalibrated predicted risks. Very-low risk patients have predicted risk of death <0.5% and high-risk patients have predicted risks ≥20% (log-rank test, p < .001)