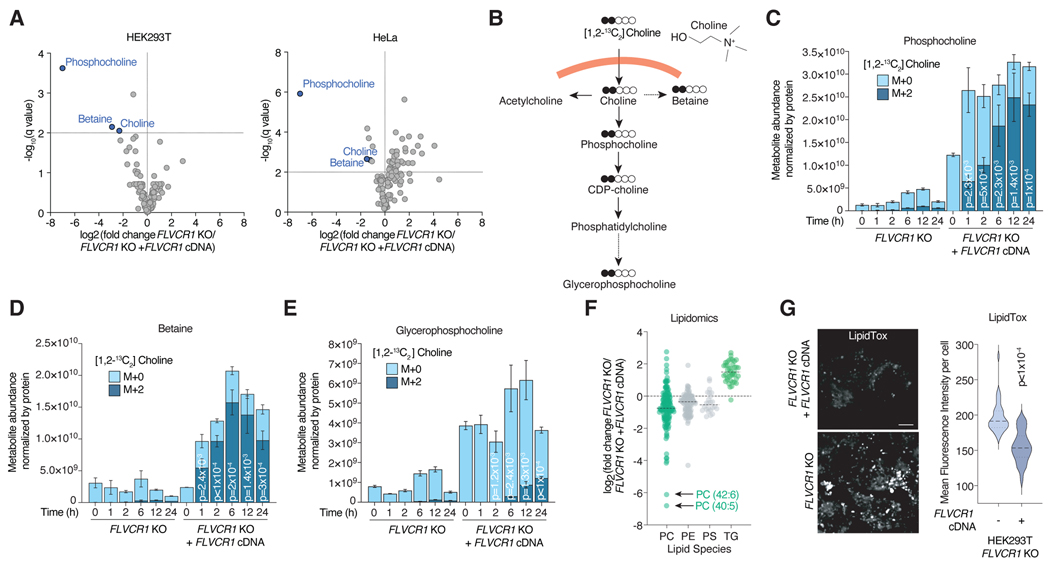
Figure 2. FLVCR1 loss impairs choline metabolism in human cells.
a) Volcano plot showing the log2 fold change in metabolite abundance versus -log10(q value) from FLVCR1-knockout HEK293T and HeLa cells expressing a vector control or FLVCR1 cDNA cultured in choline depleted media for 24 hours. The dotted line indicates the significance threshold of FDR q<1% (-log10(q value) = 2). Statistical significance was determined by multiple two-tailed unpaired t-tests with discovery determined using the Two-stage linear step-up procedure of Benjamini, Krieger and Yekutieli. b) Molecular structure of choline and schematic for tracing of [1,2-13C2]Choline into downstream metabolites. Metabolite abundance of c) phosphocholine, d) betaine and e) glycerophosphocholine after incubation with [1,2-13C2]Choline for the indicated timepoints in FLVCR1-knockout HEK293T cells expressing a control vector or FLVCR1 cDNA. Bars represent mean ± standard deviation; n = 3. Statistical significance determined by two-tailed unpaired t-test and displayed p-values compare M+2 metabolite abundance between FLVCR1 KO and FLVCR1 KO +FLVCR1 cDNA at corresponding timepoints. f) Lipidomics analysis of FLVCR1-knockout HEK293T cells expressing a control vector or FLVCR1 cDNA cultured in choline depleted media for 24 hours. Dot plot of individual lipid species of FLVCR1-knockout cells relative to FLVCR1 KO +FLVCR1 cDNA cells and grouped by lipid class – phosphatidylcholine (PC), phosphatidylethanolamine (PE), phosphatidylserine (PS), and triglyceride (TG). Dotted line represents lipid species abundance of FLVCR1 KO +FLVCR1 cDNA cells. Median log2 fold change of FLVCR1 KO cells denoted by black line for each lipid class; n = 3. g) LipidTOX staining of FLVCR1-knockout HEK293T cells expressing a control vector or FLVCR1 cDNA. Scale bar = 5μm. Violin plot showing quantification of mean fluorescence intensity per cell. Statistical significance was determined by two-tailed unpaired t-test. n = 28 cells FLVCR1 KO; n = 39 cells FLVCR1 KO +FLVCR1 cDNA.

