
Figure 5. VQ Group B myeloma cells have increased expression of cancer growth pathways and Amp1q-associated PBX1-FOXM1 gene signatures.
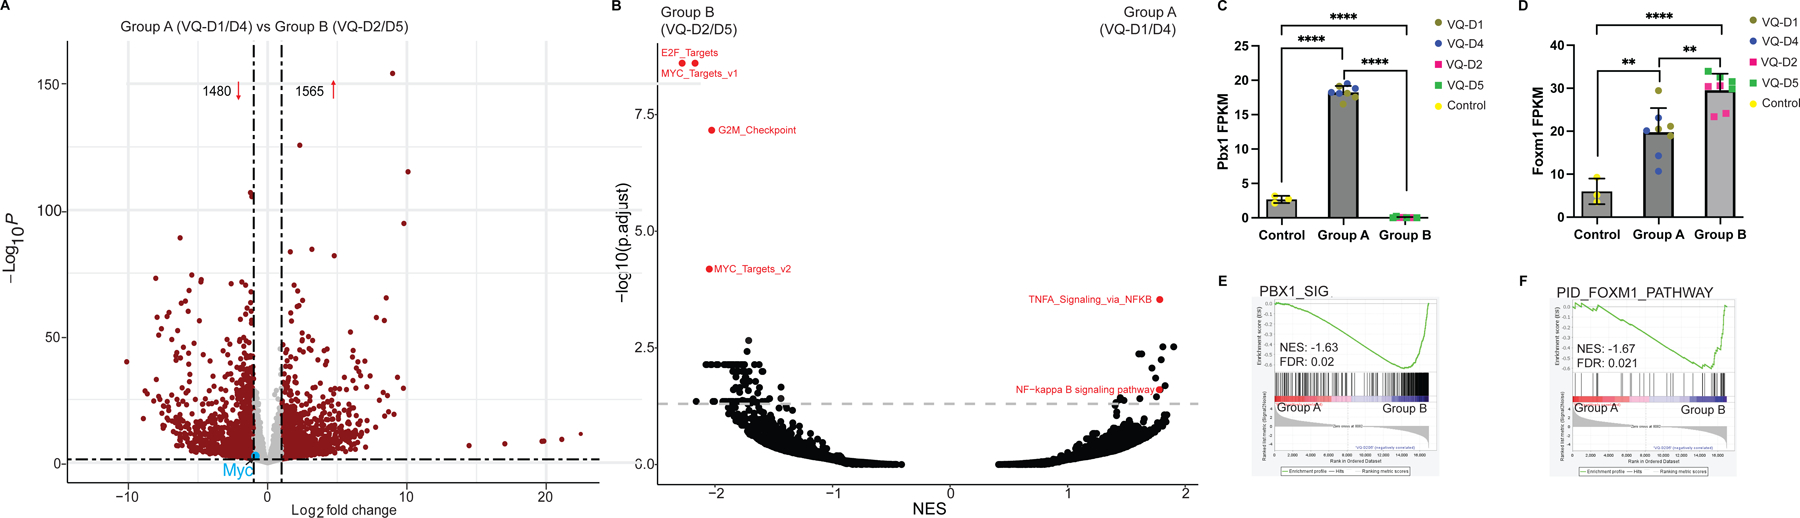
(A) Volcano plot of differentially expressed genes (red dots) in Group A (VQ-D1/D4) vs Group B (VQ-D2/D5). (B) Overview of gene set enrichment analysis between Group A (VQ-D1/D4) and Group B (VQ-D2/D5) myeloma cells. Relevant pathways are highlighted in red. (C, D) Transcript levels of Pbx1 (C) and Foxm1 (D) are shown in control and VQ Group A and B CD138+ B220− cells. (E, F) GSEA plots comparing Group A to Group B for (E) PBX1 and (F) FOXM1 gene signatures. NES, normalized enrichment score; FDR, false discovery rate; p. adj., adjusted P-value. **, p <0.01; ****, p <0.0001.