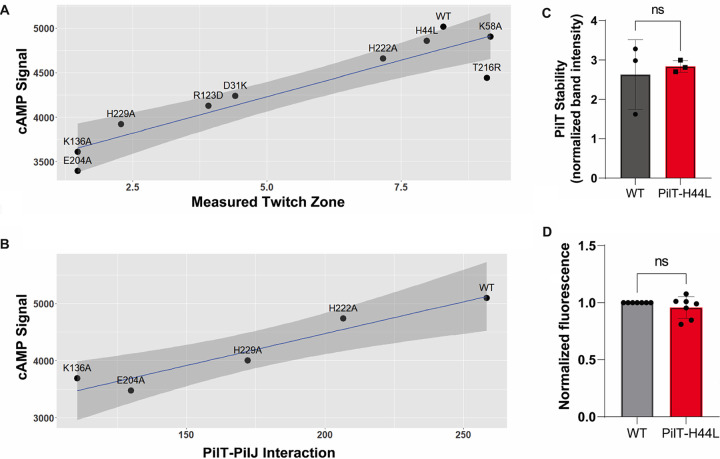
FIG 6.
cAMP levels are positively associated with TM and the extent of PilT-PilJ interaction. (A) Linear model depicting the relationship between twitching motility and surface-induced cAMP production. The model was built using data from Fig. 2, 3, and 4 using all tested alleles of pilT (R2 = 0.8565; adjusted R2 = 0.8386; P = 0.0001232). (B) Linear model depicting the relationship between level of PilT-PilJ interaction as measured by the B2H system and surface-induced cAMP production. The model was built using data from the PilT-K136A, PilT-204A, PilT-H222A, and PilT-H229A strains and the WT strain (R2 = 0.9176; adjusted R2 = 0.8902; P = 0.01029). (C) Quantification of PilT level for the PilT-H44L mutant compared to the WT strain. PilT bands were normalized by a cross-reacting band. Bars and errors bars represent the mean and standard deviation from 3 biological replicates compared to the WT. Data are from 3 biological replicates and were analyzed by one-way ANOVA, followed by Tukey’s posttest comparison. ns, not significant. (D) Normalized fluorescence from the PaQa reporter for the WT and PilT-H44L strains. Values were normalized by the WT for each biological replicate. Bars and errors bars represent the mean and standard deviation from 7 biological replicates compared to the WT. Data were analyzed by one-way ANOVA, followed by Tukey’s posttest comparison. ns, not significant.

