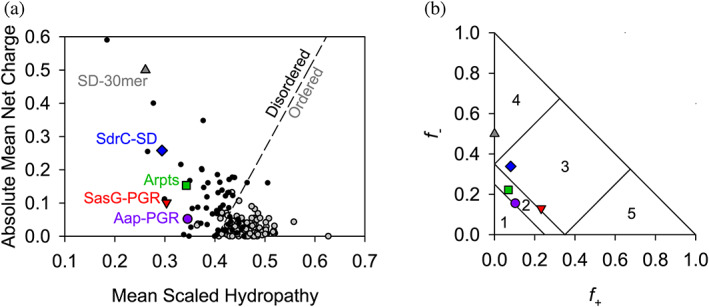
FIGURE 2.

Predictions of disorder and classification of IDP constructs. The Uversky plot (a) is a powerful predictor of disorder based on net charge and hydrophathy (Uversky et al., 2000). A reference line (dashed) separates disordered proteins (black, filled circles) and ordered proteins (gray, filled circles). All IDP constructs of interest in this study fall on the “Disordered” side of the reference line. Panel (b) shows the IDPs plotted on the Das‐Pappu phase plot (Das & Pappu, 2013). Symbols are consistent with (a). Numbers refer to the phase plot region (see Table S1).
