FIGURE 3.

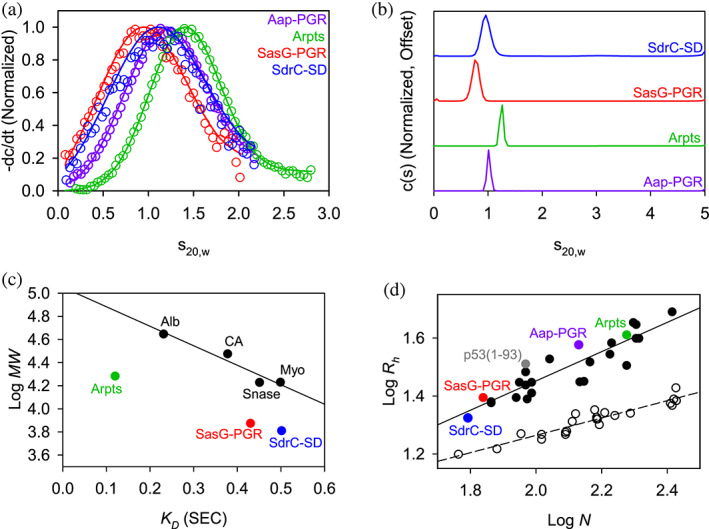
AUC and SEC indicate each construct is highly elongated and monomeric. (a) Time‐derivative distributions from sedimentation velocity data. Empty markers indicate data, with every eighth data point shown for clarity. Solid lines represent the fit to a single‐species model. (b) Sedimentation velocity AUC data suggest each construct is monomeric and highly elongated, as indicated by the fitted parameters listed in Table 1. (c) Linear relationship between SEC‐measured K D and logMW for the folded protein standards (Alb, albumin; CA, carbonic anhydrase; Myo, myoglobin; Snase, staphylococcal nuclease), showing that the IDP constructs all deviate from the trend. Aap‐PGR is omitted from this plot, as it was previously analyzed using different column resin. (d) Linear relationship between log N (number of residues) and logRh. Folded proteins (Langridge et al., 2014; Marsh & Forman‐Kay, 2010) (open circles, dashed linear regression) and IDPs (Tomasso et al., 2016) (filled circles, solid linear regression) show distinct trends. SasG‐PGR, Aap‐Arpts, and SdrC‐SD follow the trend with other IDPs. Aap‐PGR data were replotted from a previous publication for ease of comparison (Yarawsky et al., 2017).
