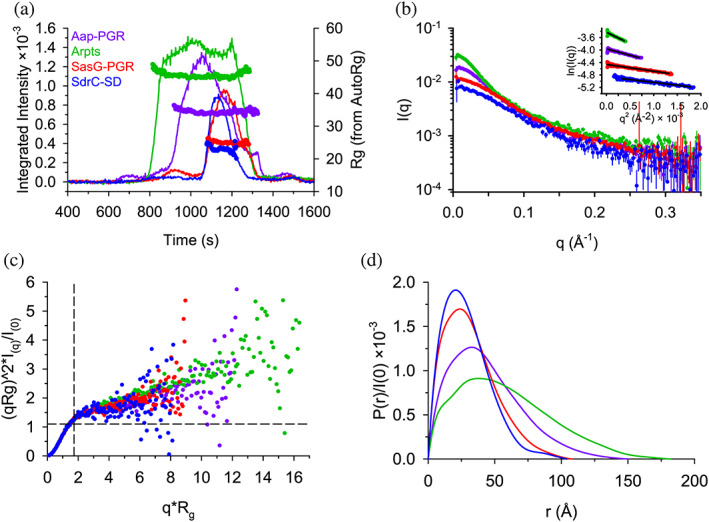
FIGURE 4.

SAXS data confirm highly extended conformations for all constructs. (a) SEC‐SAXS elution profiles showing scattering intensity (after buffer subtraction) and R g calculated using AutoRg (markers). (b) The scattering profiles for each dataset, following the same color scheme as (A). The inset shows the Guinier range with lines representing the Guinier fit. (c) The normalized Kratky plot. A spherical particle should exhibit a Gaussian shaped distribution with a maximum at the intersection of the dashed lines. (d) The P(r) distributions normalized by I(0). The D max is the maximum radius in the distribution.
