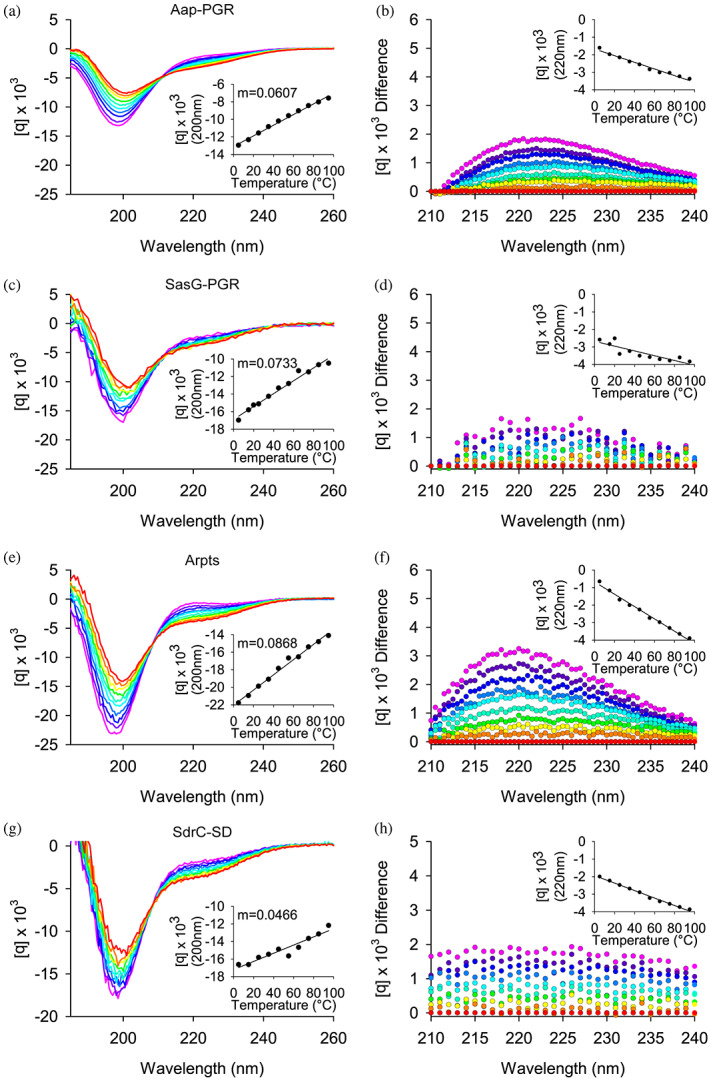
FIGURE 5.

Circular dichroism wavelength scans show constructs have primarily random coil and PPII helix content. (a) shows the wavelength scans for Aap‐PGR from 5°C to 95°C (cool to warm colors), while (b) shows the difference of each scan minus the 95°C scan. This highlights the shift in the local maximum around 220 nm. The insets highlight the linearity of the CD signal at 200 nm (a) or 220 nm (b). Data are shown for SasG‐PGR (c, d), Aap‐Arpts (e, f), and SdrC‐SD (g, h). The slope determined by linear regression of the CD signal (200 nm) versus temperature is listed as “m.” Aap‐PGR data were replotted from a previous publication for ease of comparison (Yarawsky et al., 2017).
