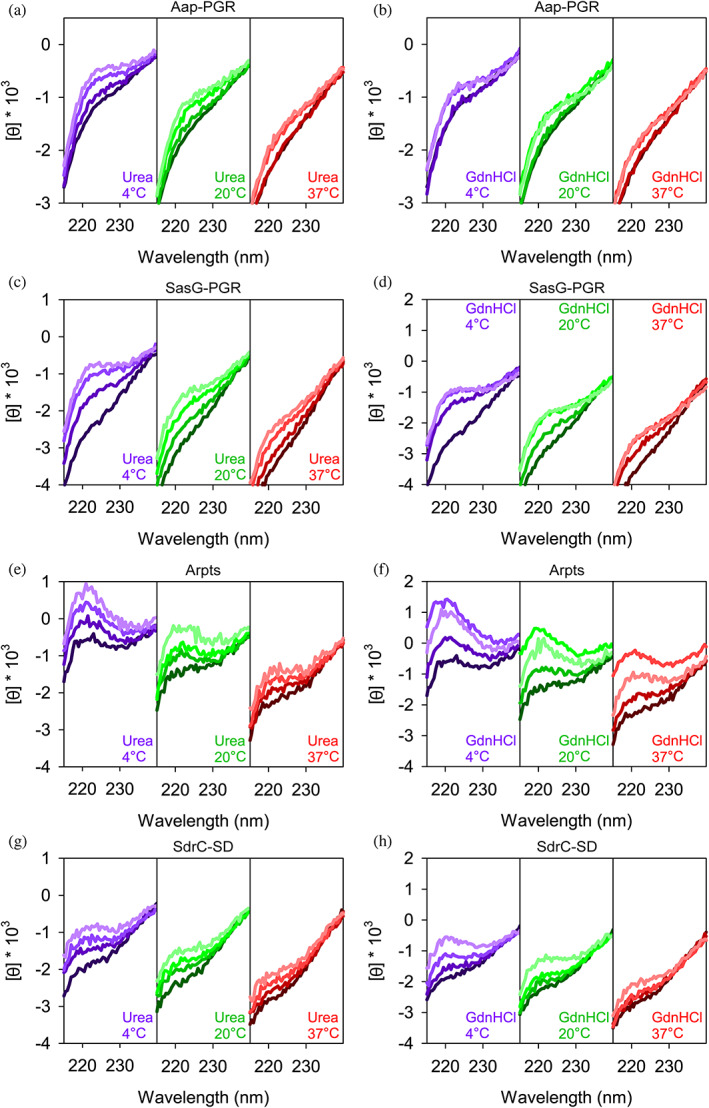
FIGURE 6.

Constructs respond to denaturants to different extents. Concentrations of urea were 0, 2, 4, 6 M, colored from darkest to lightest line colors. Plots show 0, 2, 4, 6 M GdnHCl using the same color scheme. Aap‐PGR data were replotted from a previous publication for ease of comparison (Yarawsky et al., 2017).
