
FIGURE 7.
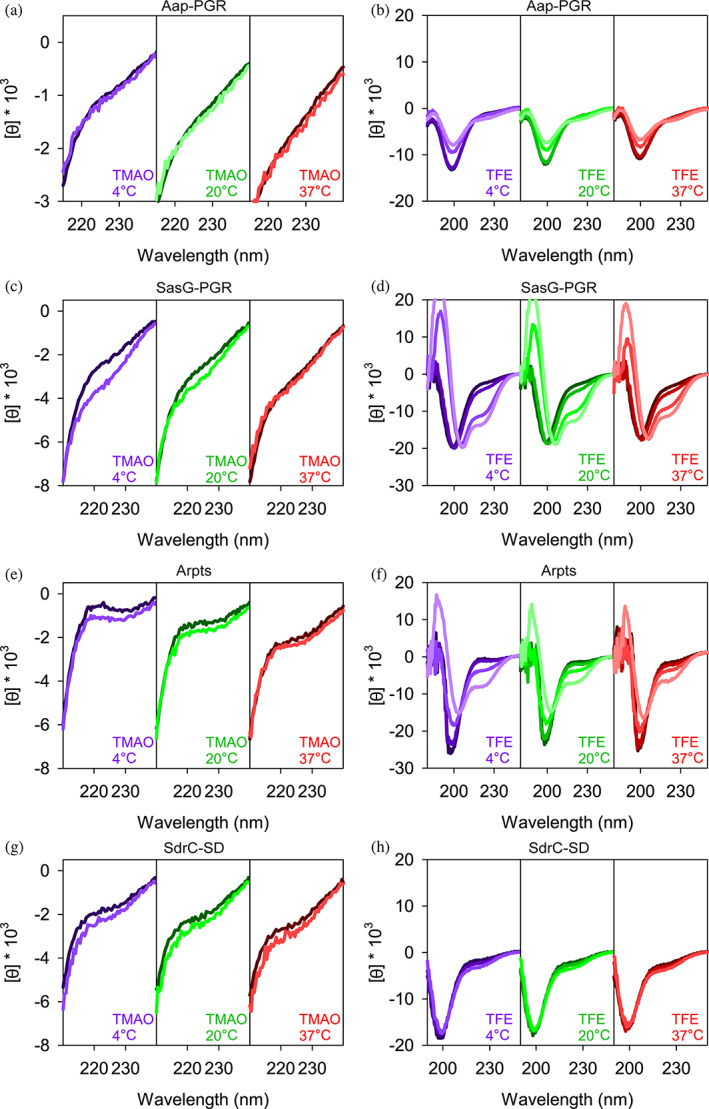
Comparison of IDP responses to TMAO and TFE. Concentrations of TMAO (a, c, e, and g) were 0 (dark line) and 3 M (light line). The ability for TFE to perturb the secondary structure is shown in (b, d, f, and h). TFE concentrations were 0, 15%, 45%, and 75% (from dark lines to light lines) except for panel H, where 75% TFE led to aggregation of SdrC‐SD. Aap‐PGR data were replotted from a previous publication for ease of comparison (Yarawsky et al., 2017).