
FIGURE 3.
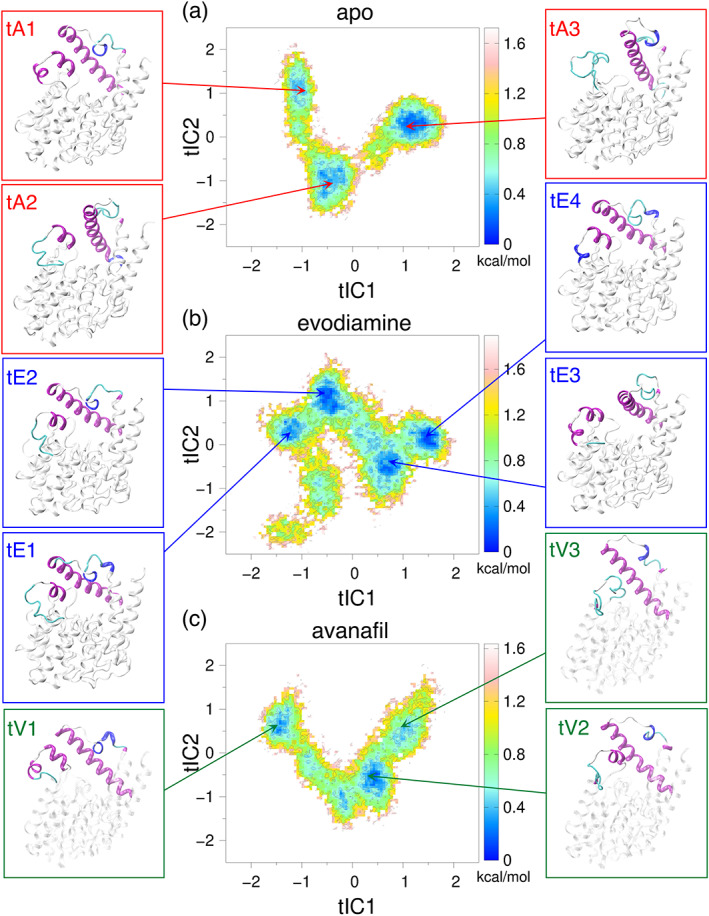
The time‐lagged independent component analysis (tICA) using backbone torsions as the input feature and a lag time of 1 ns. The free energy surface was projected along the first and second time‐lagged independent components (tIC1 and tIC2) to identify the key states for (a) apo, (b) evodiamine‐bound, and (c) avanafil‐bound systems. The representative structures corresponding to the metastable states are shown in colored boxes: apo (red boxes), evodiamine‐bound (blue boxes), and avanafil‐bound (green boxes). The secondary structure elements of the H‐loop, the α14 helix, and M‐loop are colored: α helix (magenta), 310 helix (blue), turn (gray), and coil (white). The remaining protein backbone is shown in each snapshot as a transparent white cartoon.