
FIGURE 4.
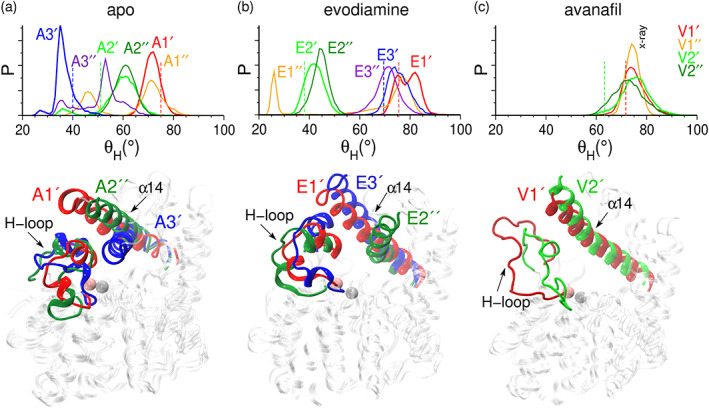
The distributions of and the structures corresponding to the mean values in distributions. (Top panels) The distributions of in different MD simulations starting from the structures corresponding to the metastable states of (a) apo, (b) evodiamine‐bound, and (c) avanafil‐bound systems. The value of in the initial structure corresponding to a given metastable state is shown as a dashed line. (Bottom panels) The conformations of the α14 helix and the H‐loop, in the representative structures from the selected states, are colored and labeled.