
FIGURE 8.
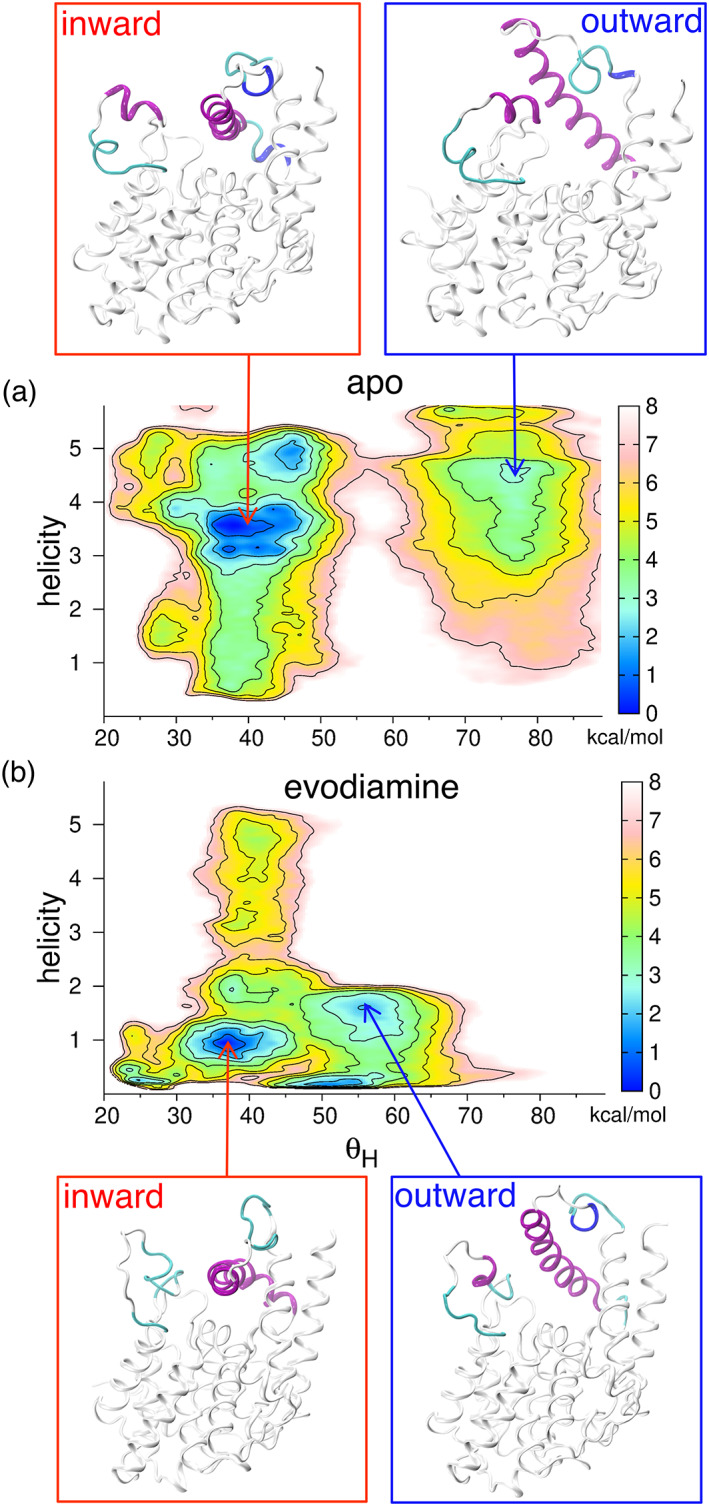
Two‐dimensional free energy surfaces obtained from well‐tempered metadynamics simulations. (a) For the apo system, the minimum for the inward state (the representative structure in red box) and another minimum for the outward state (and the representative structure in blue box) of the α14 helix are shown. (b) For the evodiamine‐bound system, the minimum for the inward state (and the representative structure in red box) and another minimum for the outward state (and the representative structure in blue box) of the α14 helix are shown. The free energy contours are drawn at every 1 kcal mol−1. Color bar indicates the scale of the free energy surface (lower, blue; higher, pink).