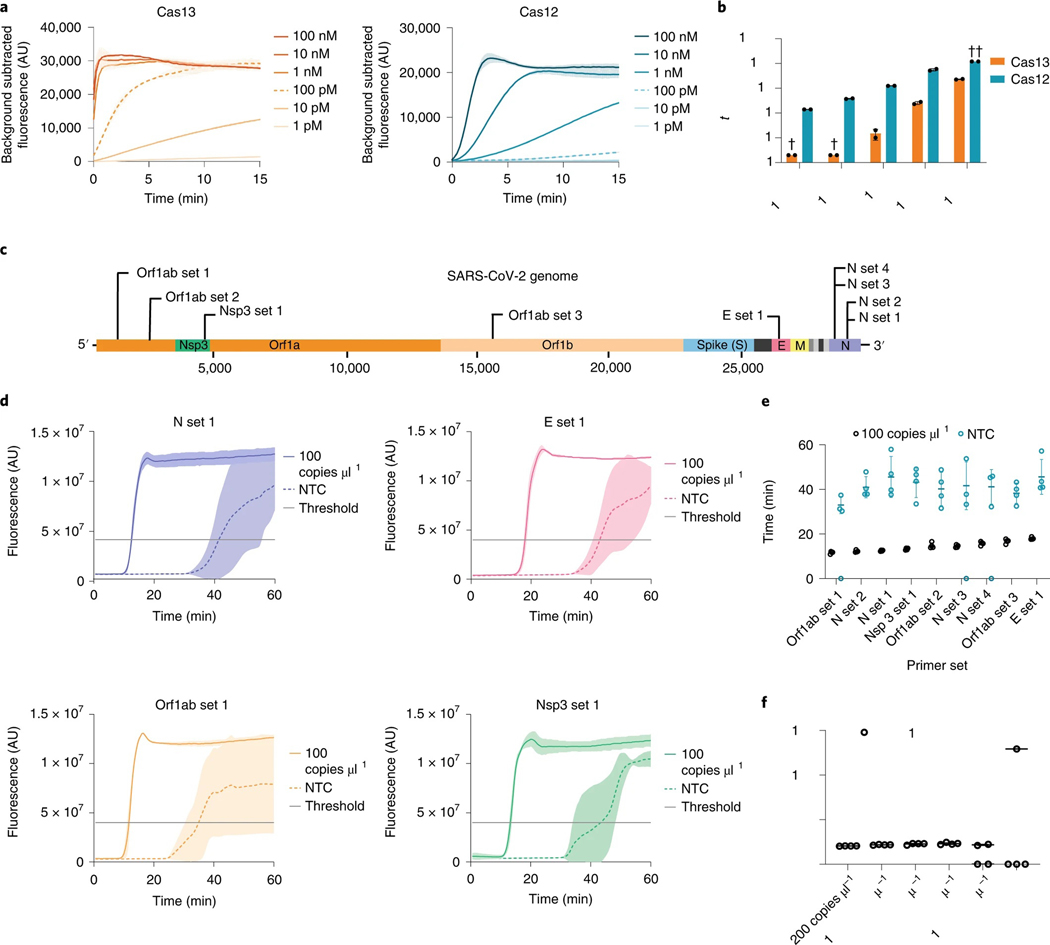
Fig. 2 |. Direct nucleic acid detection with CRISPR–Cas enzymes and LAMP.
a, Cas13 and Cas12 detection kinetics at varying activator concentrations. Line and shaded regions denote mean ± standard deviation (s.d.) with n = 3 technical replicates. b, Cas13 and Cas12 time to half-maximum fluorescence. †, time to half-maximum fluorescence was too rapid for reliable detection. ††, time to half-maximum fluorescence could not be determined within the 120 min assay runtime. Values are mean ± s.d. with n = 2 technical replicates. c, Schematic of SARS-CoV-2 genome sequence, with LAMP primer set locations indicated. d, Representative fluorescence plots of LAMP amplification of 100 copies μl−1 of synthetic SARS-CoV-2 RNA or NTC. Shaded regions denote mean ± s.d. with n = 3 technical replicates. e, Time to threshold of nine screened LAMP primer sets, targeting synthetic SARS-CoV-2 RNA or NTC. Replicates that did not amplify are represented at 0 min. Error bars represent mean ± s.d. of amplified technical replicates, n = 4. f, LOD assay of LAMP using N set 1 primer set. Replicates that did not amplify are represented at 0 min. Error bars represent mean ± s.d. of amplified technical replicates, n = 4.

