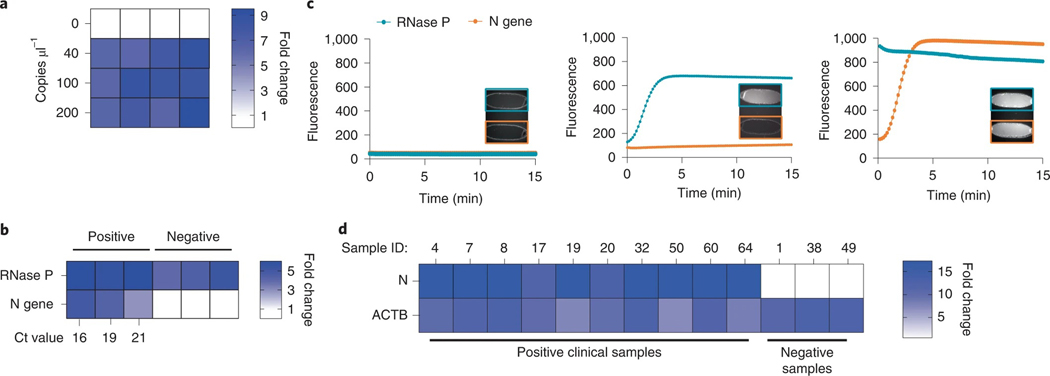
Fig. 7 |. Experimental validation of the microfluidic-driven diagnostic system.
a, Heat map depicting the fold change in DISCoVER signal on negative and positive saliva samples relative to the NTC. b, Heat map depicting the fold change in SARS-CoV-2 RNA positive and negative clinical samples from nasal swabs, relative to NTC. Ct values for N gene target by qPCR detection is listed on the heat map axis. c, Graph depicting raw fluorescence over time for both detection chambers (blue for RNase P and red for N gene) in NTC (left), negative (middle) and positive (right, Ct 16) samples. Inset within each plot is fluorescent images of detection chamber for NTC cartridge (no viral sample), negative and positive clinical sample (with RT–qPCR Ct ranging from 16 to 21). The left detection chamber is specific for N gene detection, whereas the right chamber is specific for RNase P. d, Results of on-board DISCoVER on ten clinical saliva samples and three negative clinical saliva samples. Fold increase is calculated over a blank cartridge. A two-fold fluorescence increase over blank cartridges at 50 min was the experimentally determined criterion for positive results. Samples with value below this threshold at 5 min were declared negative.

