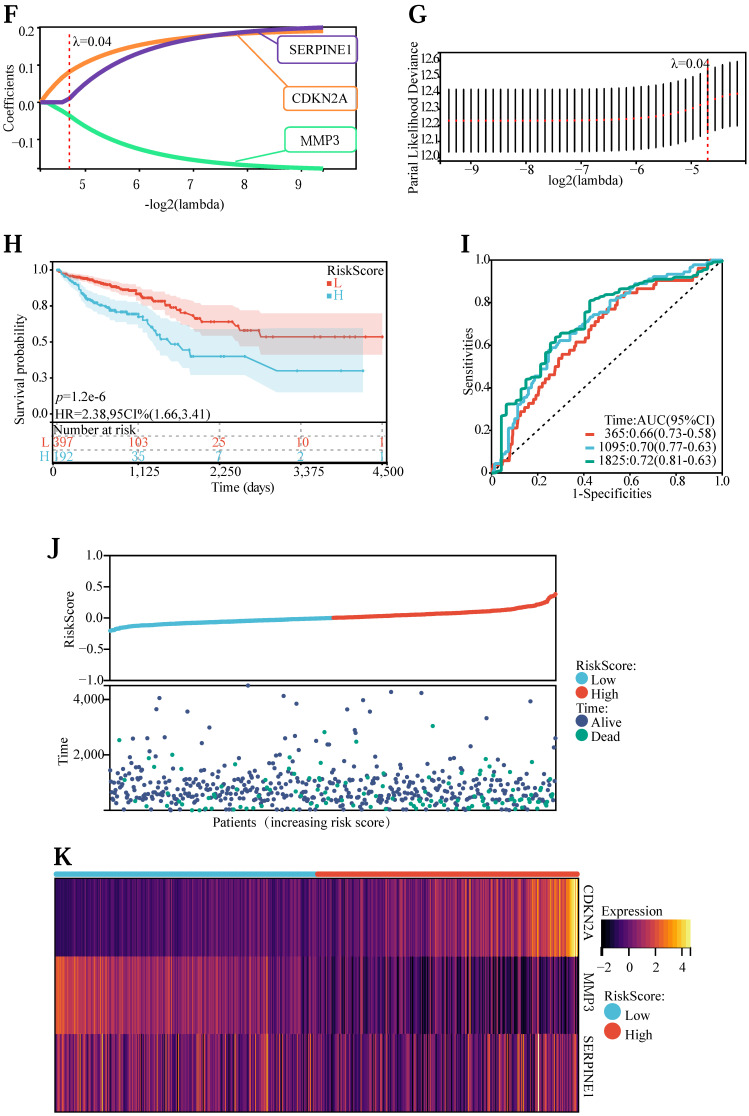
Figure 3.
(A) Heatmap of network core gene expression in the TCGA database. (B) Boxplot of differential expression of network core genes. (C) Correlation plot of core differential gene expression. (D) Unigenic Cox prognostic regression analysis of core differential genes. (E) Multigenic Cox prognostic regression analysis of core differential genes. (F, G) Lasso prognostic regression model. (H) Survival curves in the TCGA database. (I) ROC curve to verify the accuracy of risk. (J) Risk curve, risk, and survival scatter plot. (K) Heatmap of model gene expression in the high- and low-risk groups.


