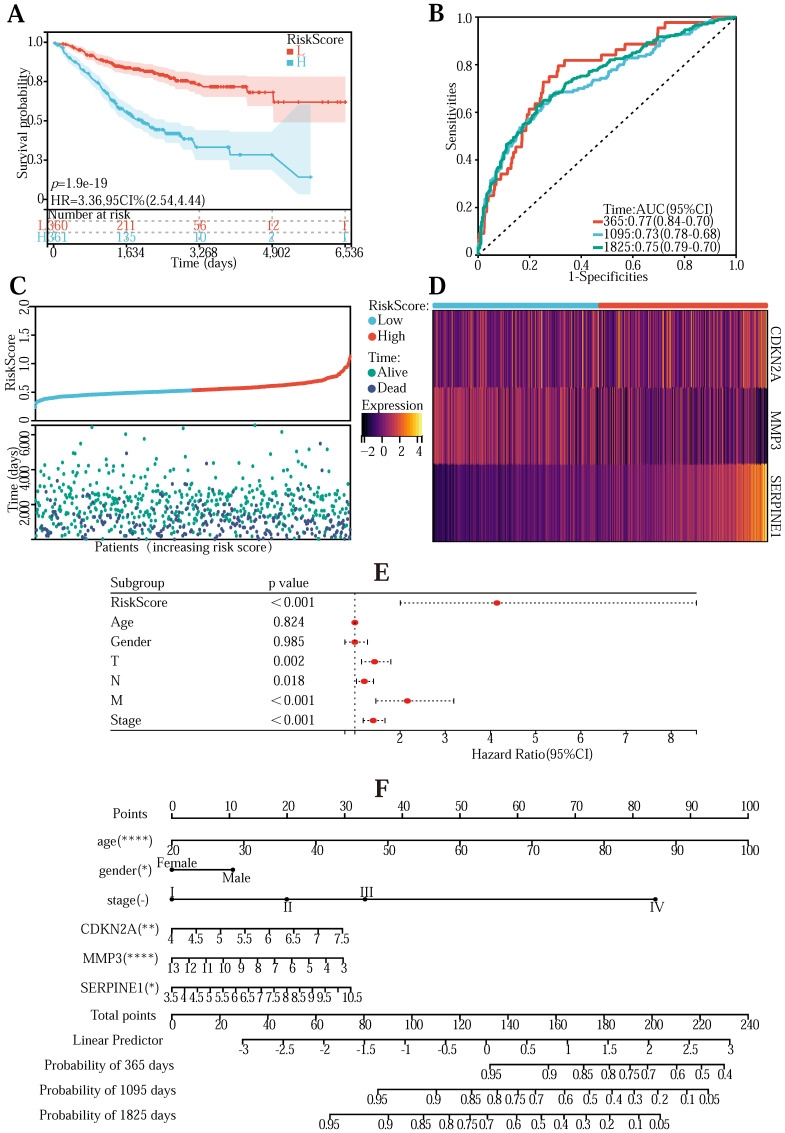
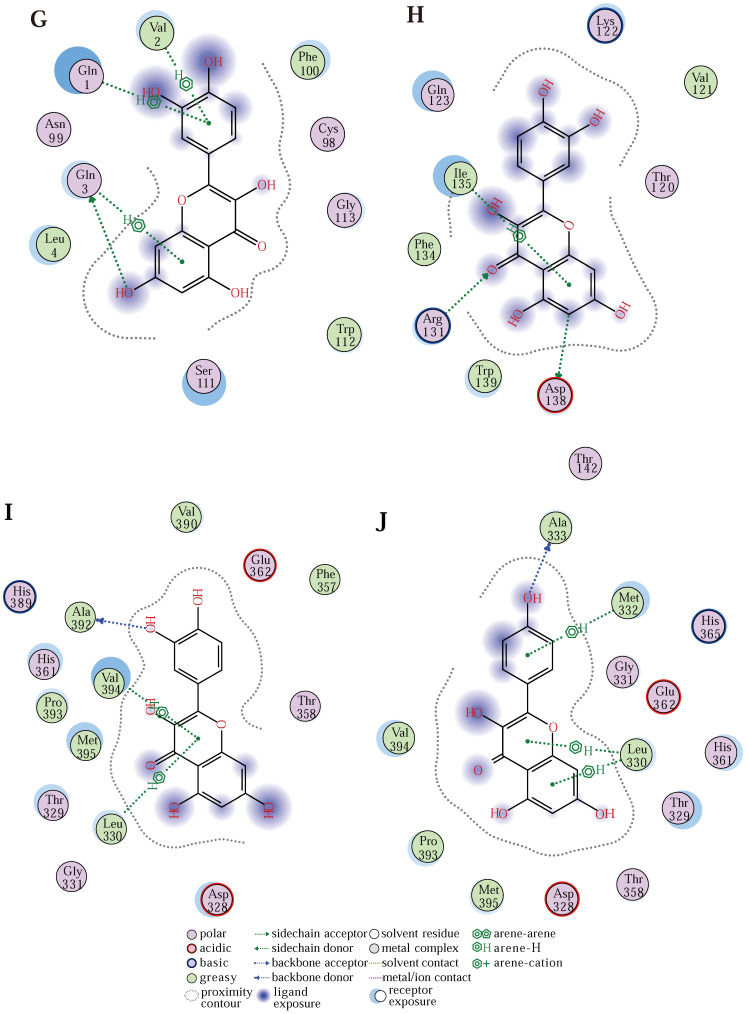
Figure 4.
(A) Survivorship curves in the GEO database. (B) ROC curve to validate the accuracy of risk. (C) Risk curve, risk, and survival scatter plot. (D) Heatmap of model gene expression in the high- and low-risk groups. (E) Univariate prognostic regression test. (F) Used to forecast survival in patients with the nomogram. (G)The predicted binding model of quercetin and CDKN2A (G), SERPINE1 (H), and MMP3 (I) proteins, and the predicted binding model of kaempferol to MMP3 (J) proteins.


