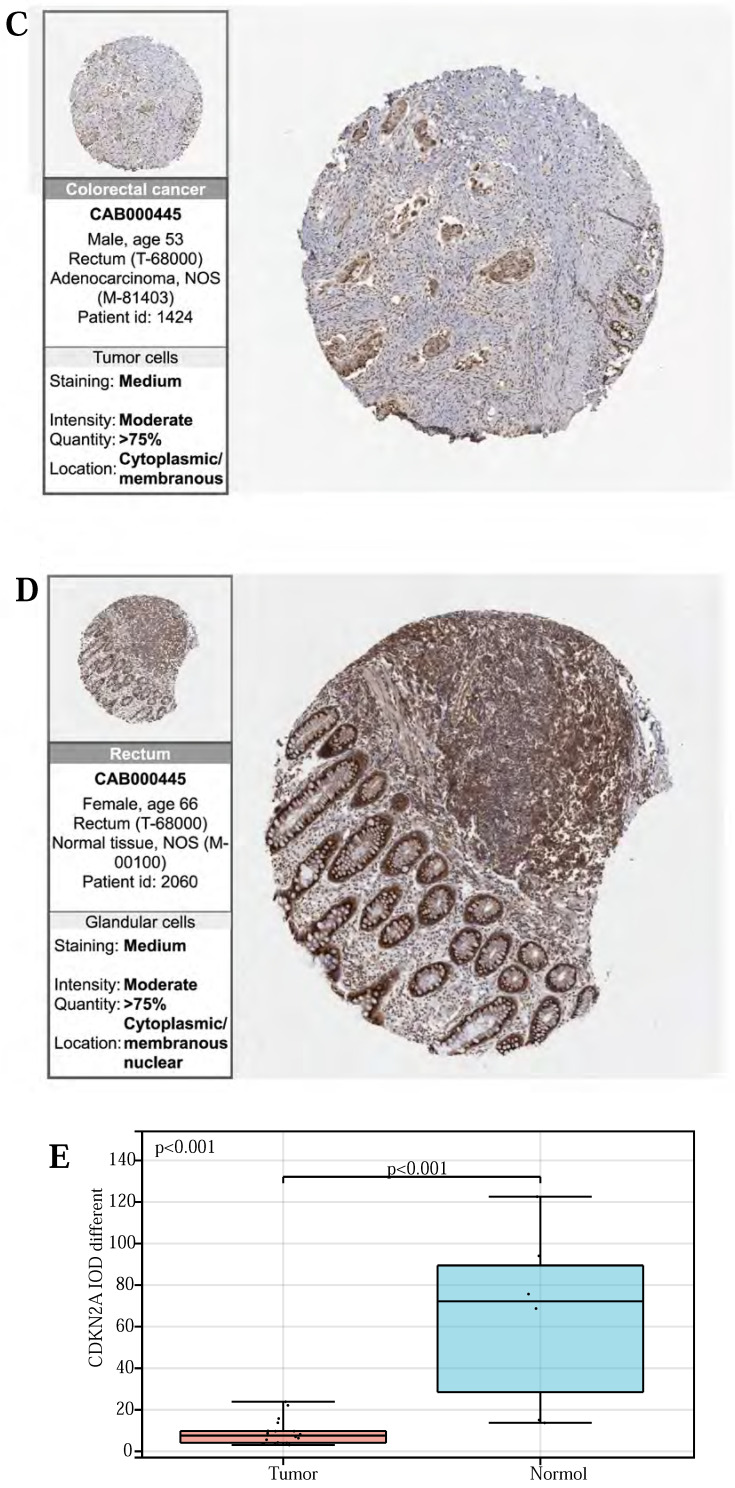
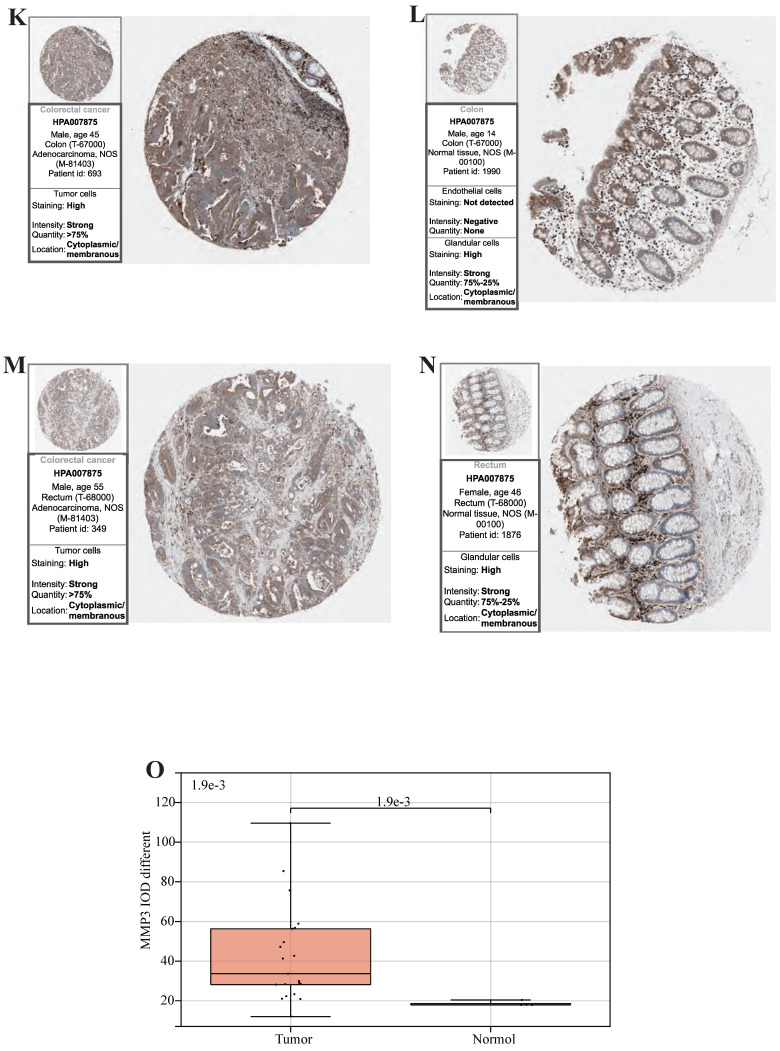
Figure 6.
(A, B, C, D) Immunohistochemical figures of CDKN2A in normal and CRC tissues from the HPA database. (F, G, H, I) Immunohistochemical figures of SERPINE1 in normal and CRC tissues from the HPA database. (K, L, M, N,) Immunohistochemical figures of MMP3 in normal and CRC tissues from the HPA database. (E, J, O) Boxplots of IOD differences in CDKN2A, SERPINE1, and MMP 3 in normal and cancer tissues, respectively.


