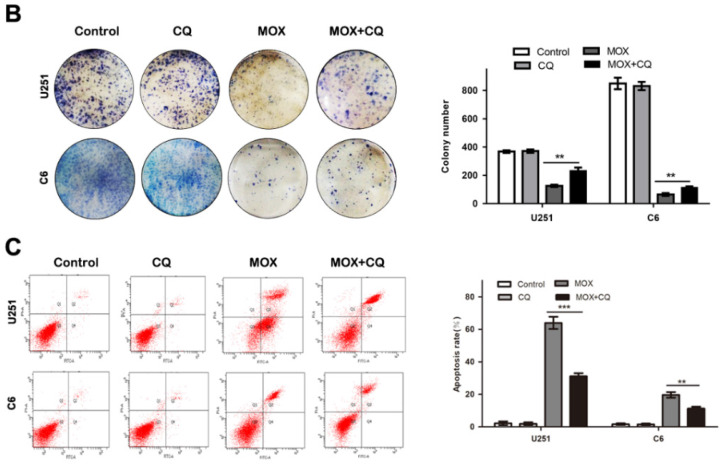
Figure 4.
Inhibition of autophagy repressed the apoptosis effect of MOX on glioma cells. Cell viability was measured by colony formation analysis (B). (C) The percentage of apoptotic cell was evaluated by flow cytometry after cells were incubated with MOX (20 µM) in the presence or absence of CQ (15 µM). Q2 plus Q4 areas were calculated as the apoptosis ratio. Data were presented as the means ± SD of three independent tests. **P < 0.01, ***P < 0.001 as compared with MOX group.

