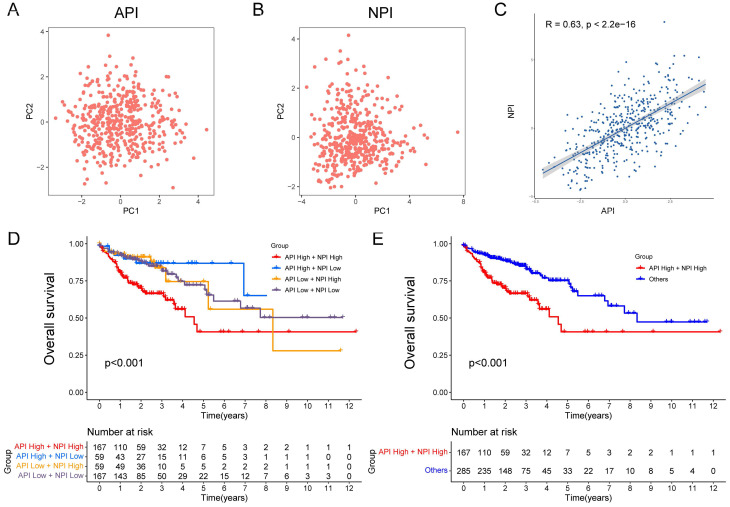
Figure 3.
Construction of API and NPI with positive correlation. PCA analysis of five prognostic angiogenesis-related genes (A) and six prognostic NETs-related genes (B). (C) Scatter plot displaying the Spearman correlation of API and NPI. The KM plots displaying overall survival in four groups (D) and two newly defined groups (E).

