Figure 7.
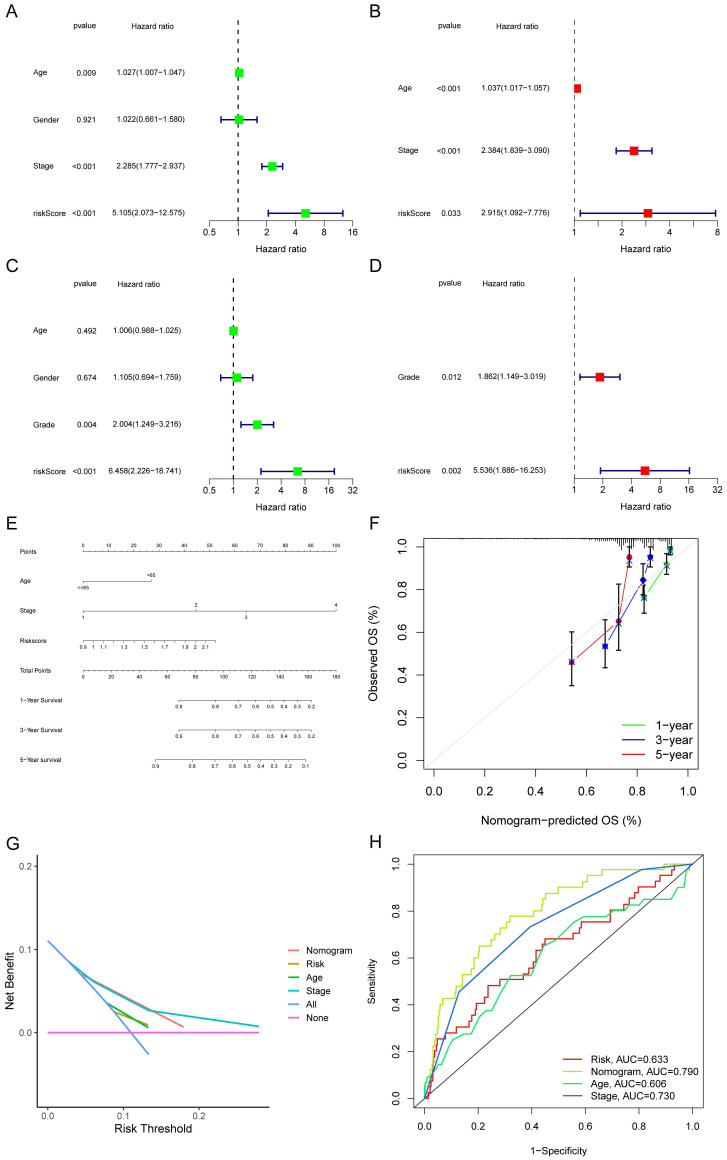
Forest plots and construction of a nomogram. Univariate Cox regression analyses displaying the association between the overall survival of patients and clinicopathological parameters along with the risk score in train set (A) and test set (C). Multivariate Cox regression analyses revealing independent prognostic factors in train set (B) and test set (D). (E) Nomogram depending on the risk score and other clinicopathologic features predicting the 1 -,-3 - and 5-year overall survival for COAD patients. (F) Calibration curves uncovering the consistency between predicted and observed 1-, 3- and 5-year overall survival rates in COAD patients based on the nomogram. DCA curve (G) and ROC curve (H) of nomogram, risk and other clinicopathologic features in COAD.

