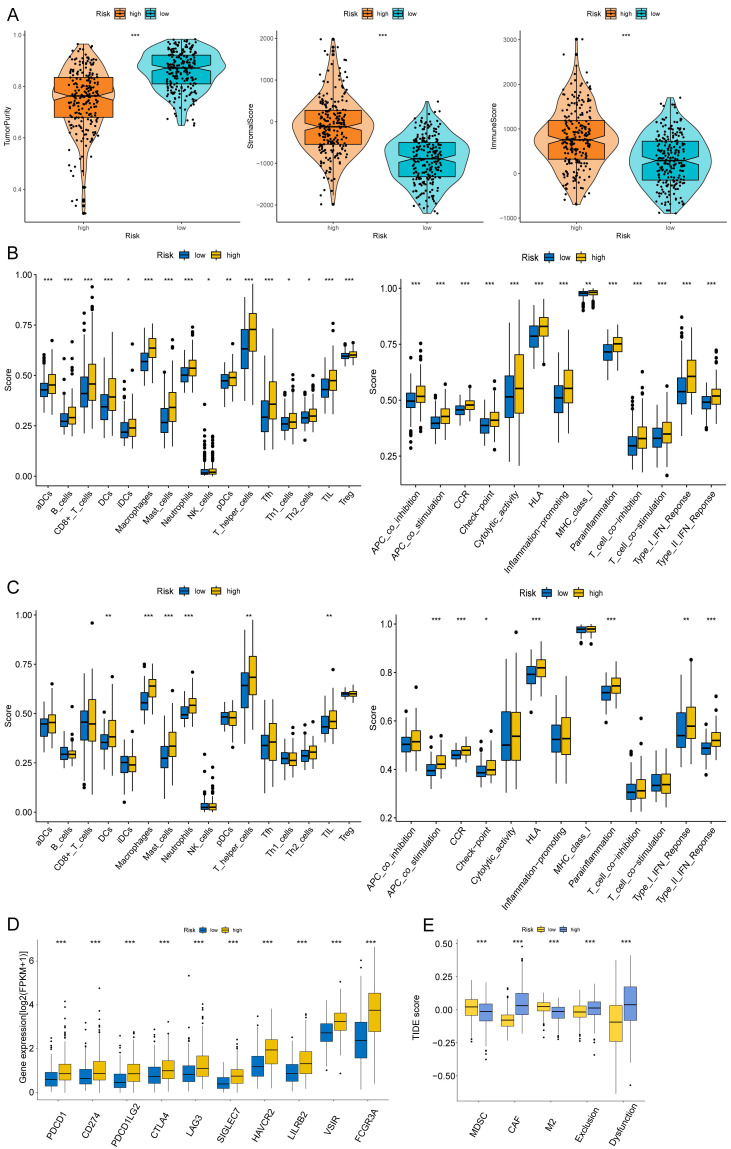
Figure 8.
Immune infiltration analysis of the prognostic risk model. (A) The box-violin plots displaying the difference of the tumor purity, stromal score and immune score in two groups. The infiltrating levels of 16 immune cell types and the infiltrating levels of 13 immune functions in train set (B) and in test set (C) estimated by ssGSEA. (D) The expression box plots of 10 common immune checkpoints between low- and high-risk groups. (E) TIDE analysis revealing the difference of tumor immune dysfunction and exclusion in two groups. *P < 0.05; **P < 0.01; ***P < 0.001.

