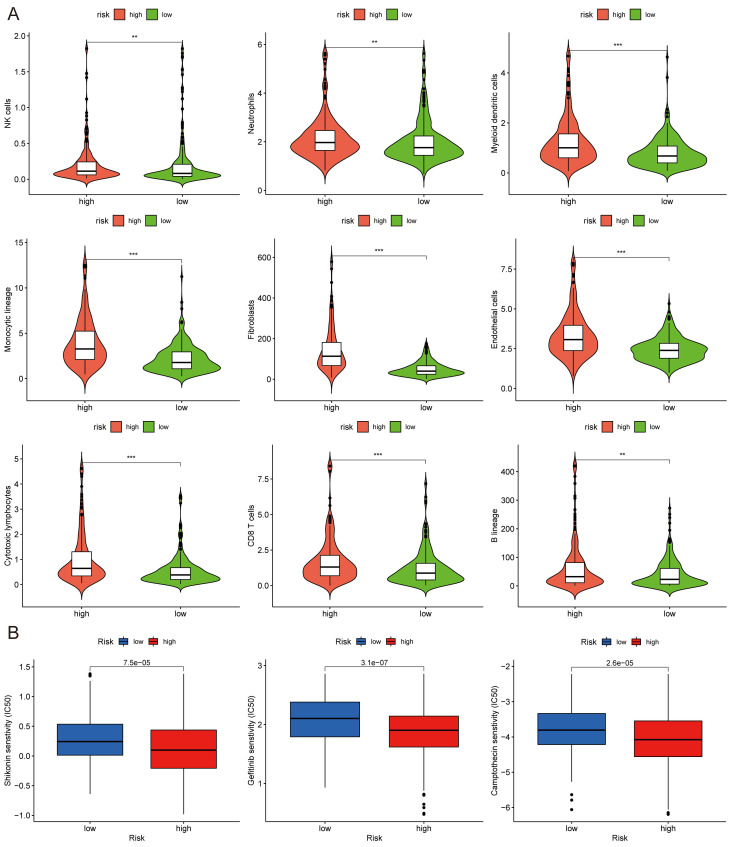
Figure 9.
MCPcounter and drug sensitivity analyses of low-risk and high-risk group. (A) The violin diagrams showing the abundance of nine types of differentially expressed immune and stromal cells between two groups using MCPcounter. (B) Sensitivity difference of three common chemotherapeutic drugs in two groups. *P < 0.05; **P < 0.01; ***P < 0.001.

