
FIG 3.
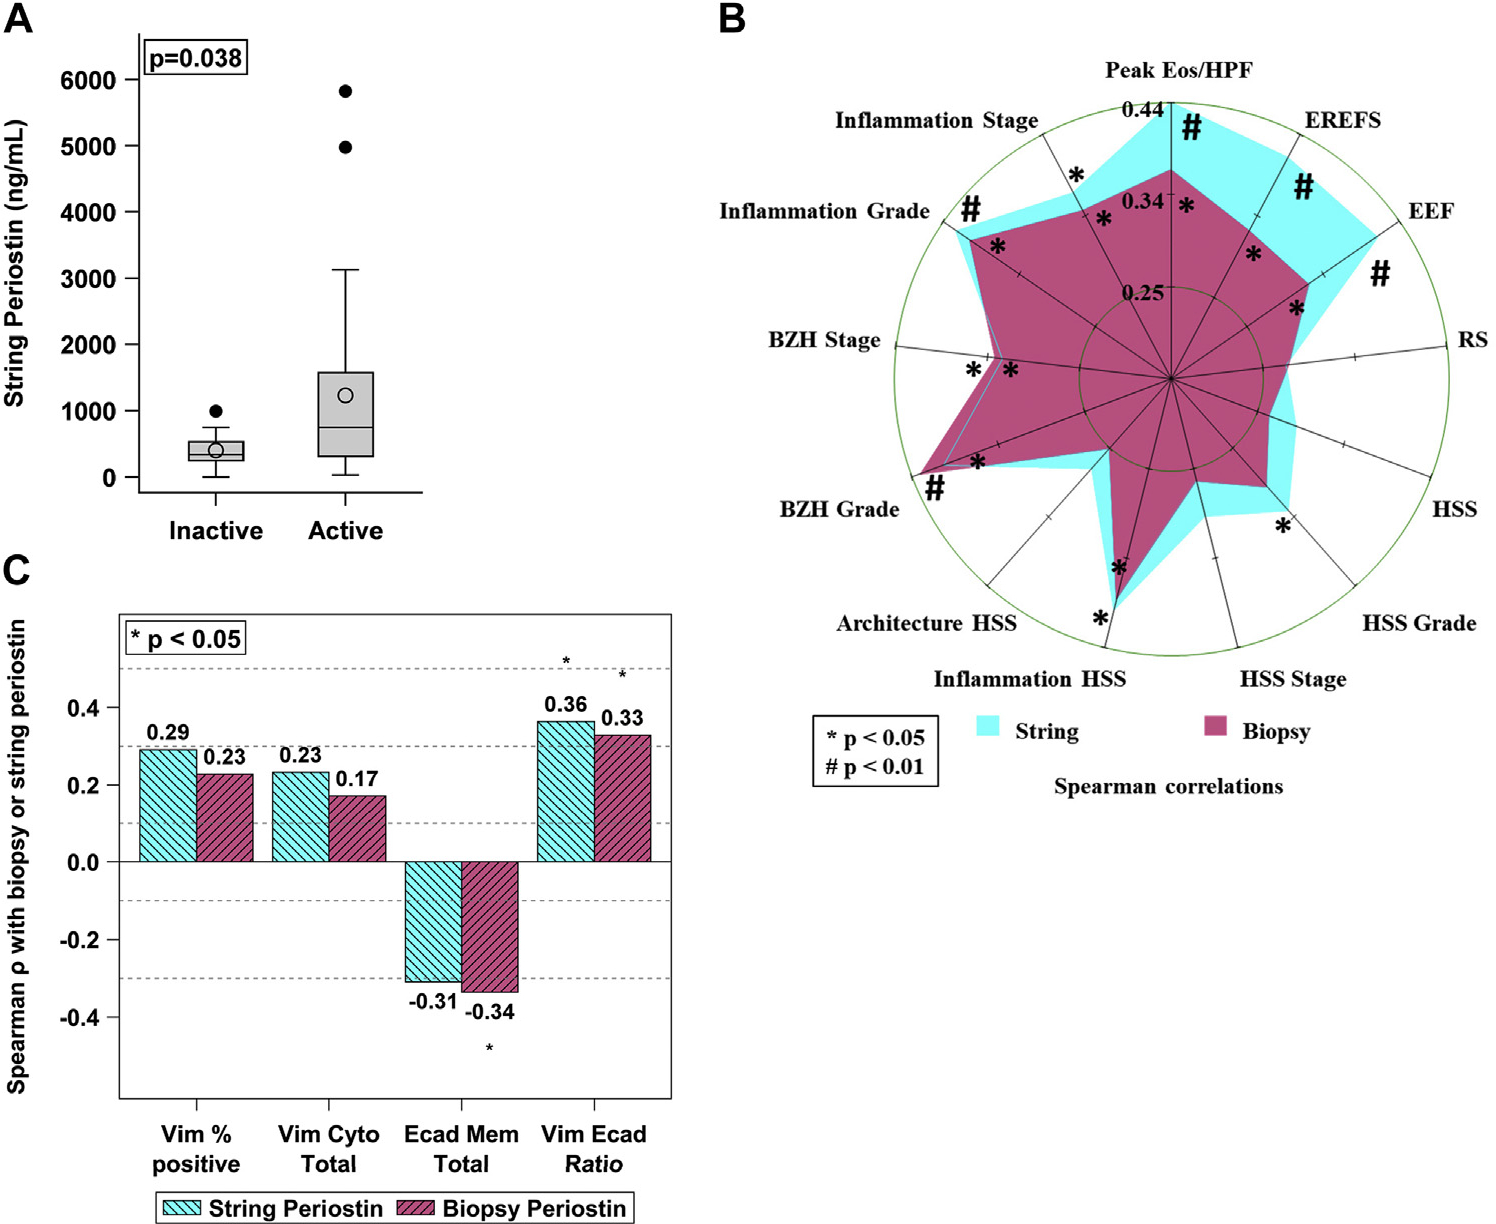
String periostin correlates with histologic and endoscopic findings as well as EMT markers. Periostin detected by the string was increased in active EoE compared to inactive EoE (A). Spearman analysis correlating EST periostin levels with endoscopic and histologic scoring by way of a radar plot (B) and EMT markers (C). Axes of the radar plot (B) are equally scaled from 0 to 0.40. Inner and outer circles indicate, respectively, minimum and maximum Spearman ρ correlation coefficients. The crossing point of a star with an axis is the estimate of the Spearman correlation with P, shown as *P < .05; #P < .01.