FIGURE 2.
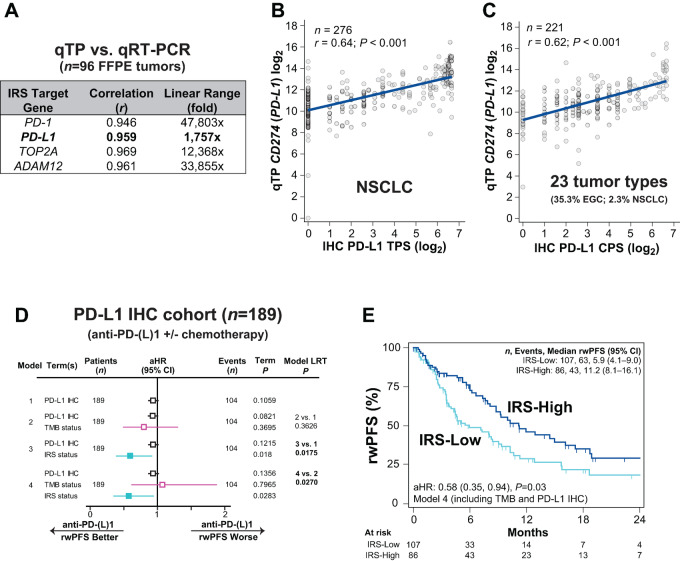
Confirmation of the added utility of the IRS versus clinical PD-L1 IHC and TMB alone. A, Normalized PD-L1 (CD274) expression (and the other IRS expression components) by the qTP platform used to generate IRS were validated versus qRT-PCR in a validation cohort of 96 FFPE tumor tissue samples tested by clinical CGP and in parallel qTP. The Pearson correlation and linear range of each component is shown (Supplementary Fig. S1). B and C, The Pearson correlation of normalized PD-L1 expression by qTP [log2 normalized reads per million (nRPM) units] versus clinical PD-L1 IHC score (in submitted pathology reports) was determined in two cohorts of clinical FFPE tumor tissues [regardless of TMB availability and anti-PD-(L)1 treatment]. B, PD-L1 expression by qTP (log2 normalized units) versus PD-L1 IHC by TPS [using the 22C3 antibody clone (log2 TPS) in 276 clinically tested FFPE NSCLC tumors with available TPS is plotted]. The linear fit, Pearson correlation (r), and P value are shown. C, PD-L1 expression by qTP versus PD-L1 IHC by CPS using the 22C3 antibody clone (log2 CPS) in 221 clinically tested FFPE tumors (23 tumor types; most frequently EGC) with available TPS is plotted. The linear fit, Pearson correlation (r), and P value are shown. D, Using B and C, we identified a cohort of all 189 eligible NCT03061305 patients with IRS and PD-(L)1 IHC in accompanying pathology reports who were treated with anti-PD-(L)1 therapy (± chemotherapy). The association of biomarkers with anti-PD-(L)1 rwPFS was determined by Cox proportional hazards modeling [adjusting for age, sex assigned at birth, line of therapy, tumor type, therapy type (monotherapy vs. chemotherapy combination), and inclusion in IRS discovery status]. PD-L1 IHC score (continuous; log2) was included in the baseline model (Model 1), with the aHR, 95% CI, number (n) of patients and events, and P value shown for the biomarker term by forest plot. TMB status (-H vs. -L; pink) and IRS status (-H vs. -L; light blue) were separately added to this model (Models 2 and 3, respectively). The significance of each biomarker term is shown and the P value of the LRT comparing the full (Model 2 or 3) versus reduced (Model 1) model is shown. Model 4 includes PD-L1 IHC, TMB, and IRS. Significant biomarker terms are shown by filled in aHR estimates. E, Anti-PD-(L)1 rwPFS stratified by IRS group is shown by unadjusted Kaplan–Meier analysis, with the aHR from Model 4 in D shown. See Supplementary Table S7 for full subgroup analysis.

