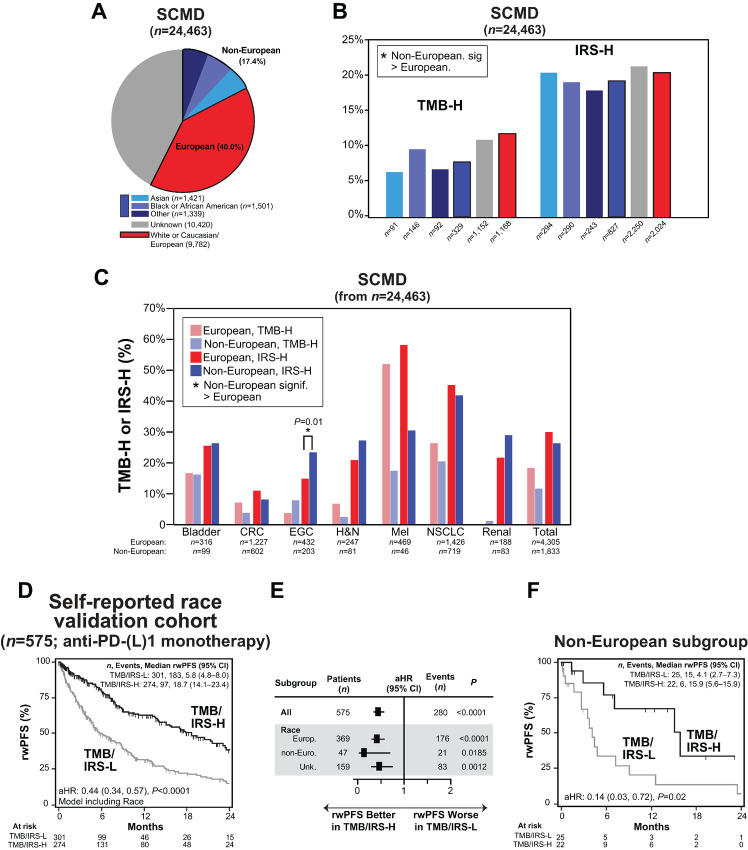
FIGURE 3.
IRS is robust to self-reported race. A, Pie chart of self-reported race for all 24,463 patients in the SCMD with informative TMB and gene expression data needed to generate IRS regardless of treatment history (SCMD lock at the time of IRS development). The total number of patients in each racial group is shown. B, The percentage of TMB-H and IRS-H patients from the SCMD (n = 24,463 as in A stratified by self-reported race is plotted). Fisher exact test was used to test the differences in IRS-H (or TMB-H) between the White or Caucasian/European group and all other groups; groups where IRS-H (or TMB-H) was significantly greater (P < 0.05) versus the White or Caucasian group (potentially as a consequence of inappropriate filtering of germline variants in TMB determination for non-White or Caucasian groups) are indicated by *. Asian, Black or African American and Other groups were also considered together as non-European (blue). C, Further breakdown by TMB and IRS status and relevant tumor types. The percentage of IRS-H (bold hue) and TMB-H (light hue) stratified by White or Caucasian/European (red) and non-European (blue) self-reported race is plotted for the n = 6,138 total patients from A and B with one of the seven indicated primary tumor types (CRC = colorectal, EGC = esophagogastric, H&N = head and neck, Mel = melanoma, NSCLC = non–small cell lung carcinoma). The total number of European and non-European patients with each tumor type are indicated. D, Across eligible NCT03061305 patients treated with anti-PD-(L)1 monotherapy, we identified a validation cohort of all 575 patients not included in IRS discovery to assess the robustness of IRS (and the TMB component) to self-reported race. Anti-PD-(L)1 monotherapy rwPFS stratified by combined TMB and IRS status [TMB-H or IRS-H (TMB/IRS-H; black) vs. TMB-L and IRS-L (TMB/IRS-L; gray)] is shown (left) by unadjusted Kaplan–Meier analysis with the aHR [adjusted for age, sex assigned at birth, line of therapy, tumor type, anti-PD-(L)1 therapy type, inclusion in previous validation cohort, and self-reported race (non-European, unknown, or European)], 95% CI and P value for TMB/IRS status (TMB/IRS-H vs. TMB/IRS-L) shown. The number (n) of patients, events, and median rwPFS (with 95% CI) for each group are shown. E, Forest plot of rwPFS by IRS status in the cohort (all) and each self-reported racial group is shown. Significant associations are shown by filled in aHR estimates. F, Anti-PD-(L)1 monotherapy rwPFS stratified by TMB/IRS status is shown by unadjusted Kaplan–Meier analysis for the non-European subgroup (as in the overall cohort).

