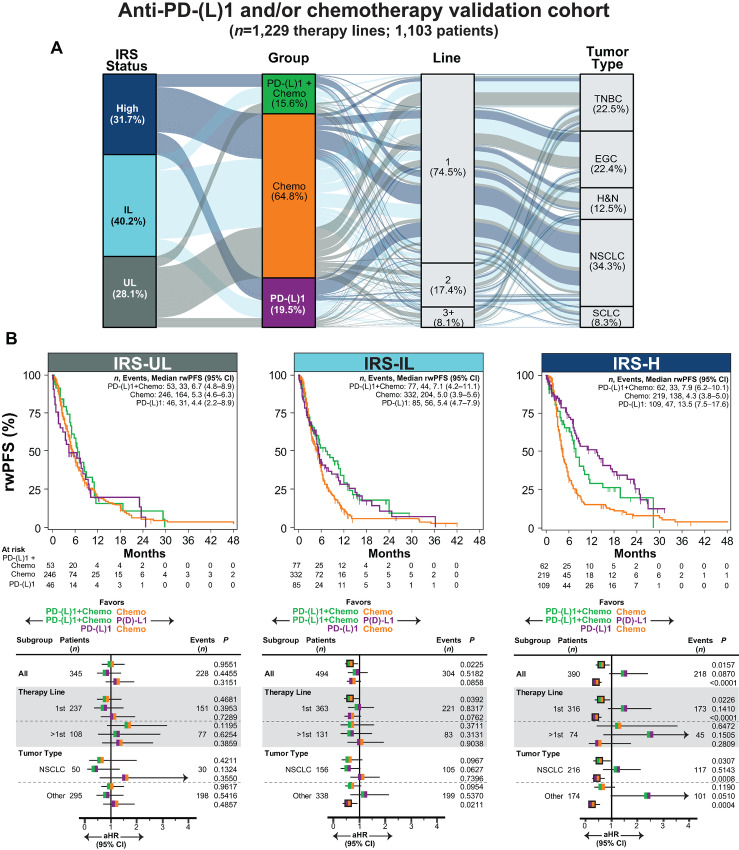
FIGURE 4.
Validation of IRS to stratify anti-PD-(L)1, chemotherapy and anti-PD-(L)1 + chemotherapy benefit in relevant tumor types. A, Clinical characteristics of the anti-PD-(L)1 and/or chemotherapy (chemo) validation cohort are shown in an alluvial diagram. Across all eligible NCT03061305 patients treated with anti-PD-(L)1 monotherapy, chemotherapy, or anti-PD-(L)1 + chemotherapy, we identified a validation cohort of 1,229 total eligible therapy lines (from 1,103 patients) in five relevant tumor types with anti-PD-(L)1 and/or chemotherapy treatment decisions: NSCLC, TNBC, EGC, H&N, and SCLC. Anti-PD-(L)1 ± chemotherapy lines used in IRS training were excluded. The IRS model and three-group classification thresholds were used to assign IRS-UL (gray), IRS-IL (light blue), and IRS-H (dark blue) status. For all 1,229 eligible therapy lines, IRS status, treatment group [PD-(L)1: purple; chemo: orange; PD-(L)1+chemo green], the systemic line of treatment, and tumor types are shown. Stratum are colored by IRS status. B, rwPFS by treatment group is shown separately for each IRS group by unadjusted Kaplan–Meier analysis. The number (n) of patients, events, and median rwPFS (with 95% CI) are shown. Treatment group outcomes were compared in each IRS group by Cox proportional hazards modeling (adjusting for age, gender, treatment group, line of therapy, tumor type, and PD-L1 RNA expression). Forest plots were used to visualize the aHR for each treatment group comparison, with the 95% CI, number of patients and events, and P value for each comparison shown. aHR estimates are colored by the treatment group comparison and significant associations are shown by outlined aHR estimates. In addition to the entire cohort (All), key subgroups are shown. See Supplementary Fig. S6 for covariate adjusted plots, Supplementary Fig. S7 for overlap weighting propensity score analysis, and Supplementary Table S12 for full subgroup analysis.

